Raw data on the left, people on the right, and everything in between. Hover or tap any box to trace where it comes from and where it goes.
DataWhat comes in
Tools I buildPipelines, plugins, apps, maps
ProductsWhat comes out
PeopleWho it’s for
Common threads
Approaches that recur across the projects and where you can see them.
Automate the whole job
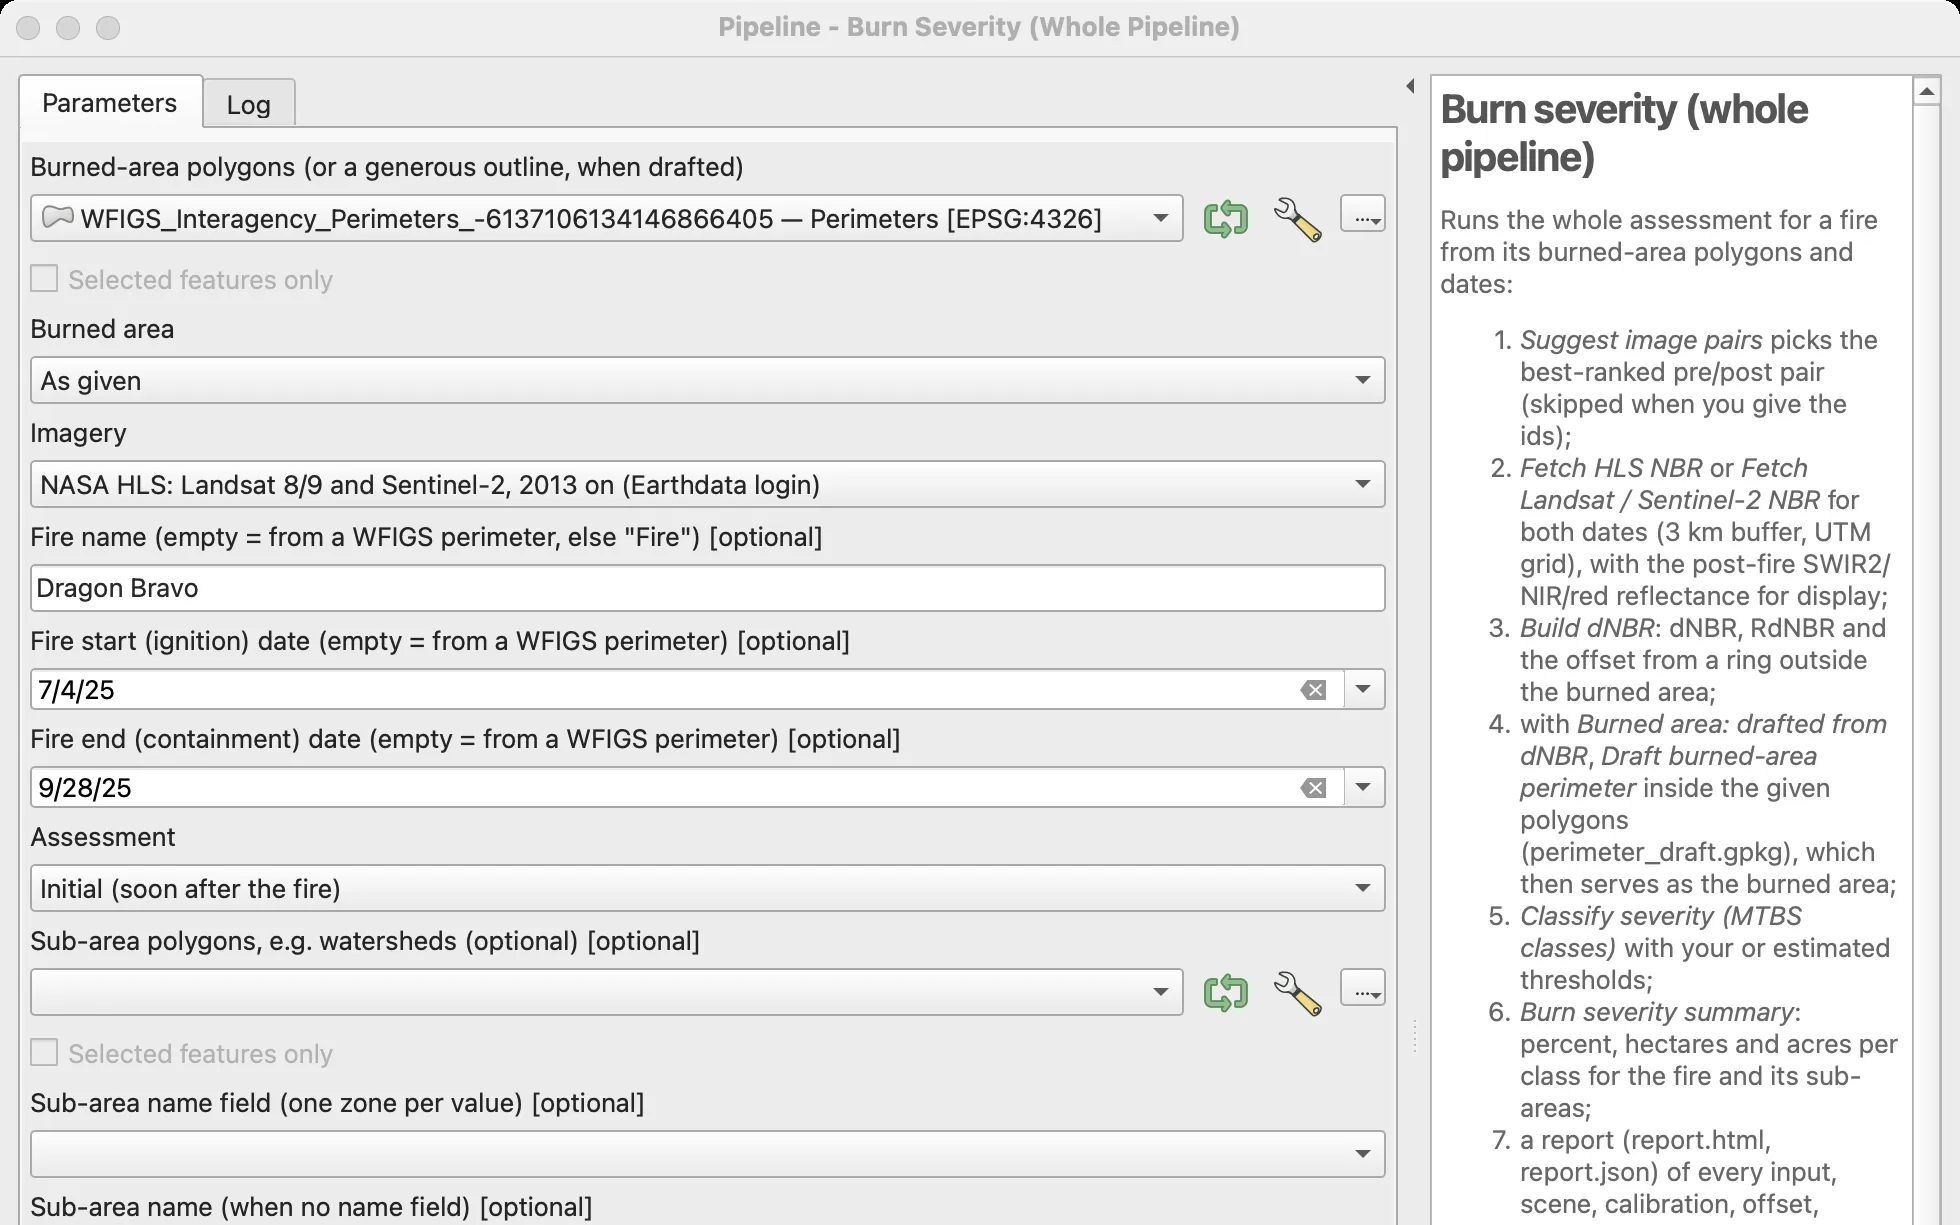
A run should start from one dialog or one config file, not a checklist. The Wildfire Analysis Toolkit goes from a fire perimeter to a severity map and report in one dialog, in about two minutes; the HLS pipeline and NAIP Harvest each run from a single config file.
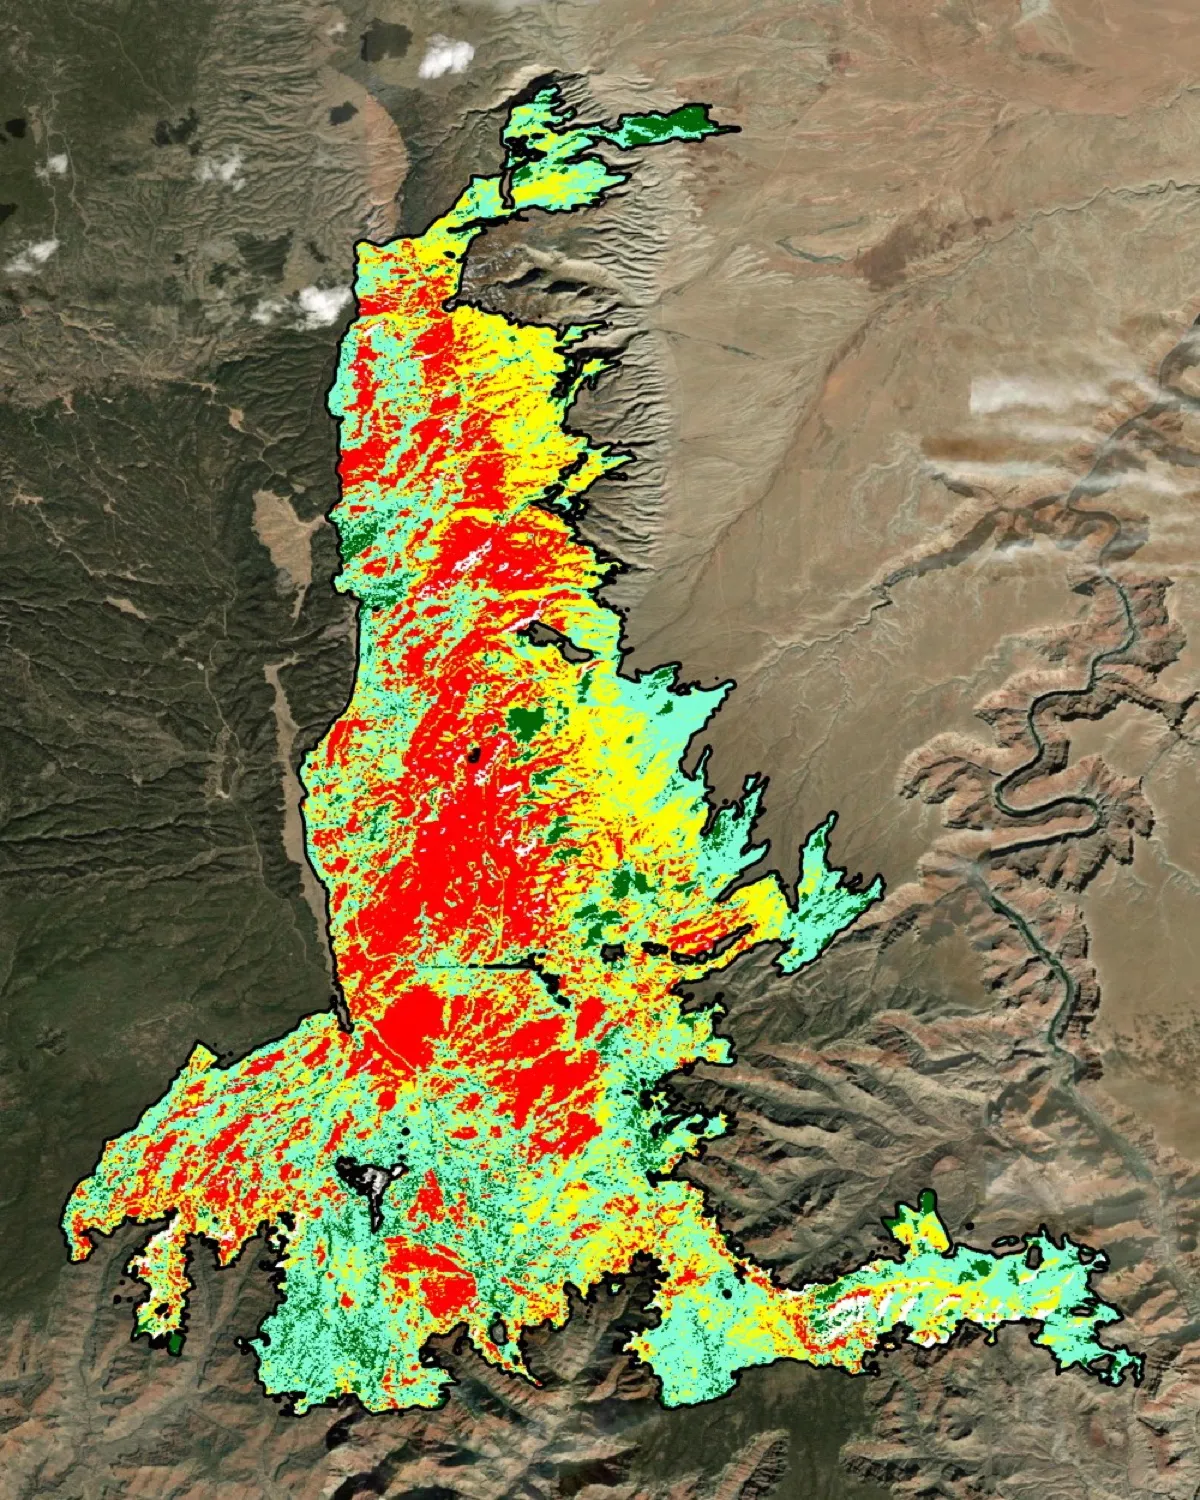
Results are tested against published data. Given MTBS’s own images, perimeters and thresholds, the Wildfire toolkit reproduces the federal burn-severity classes with a mean Cohen’s kappa of 0.78, and every satellite scene is calibrated from its own metadata.
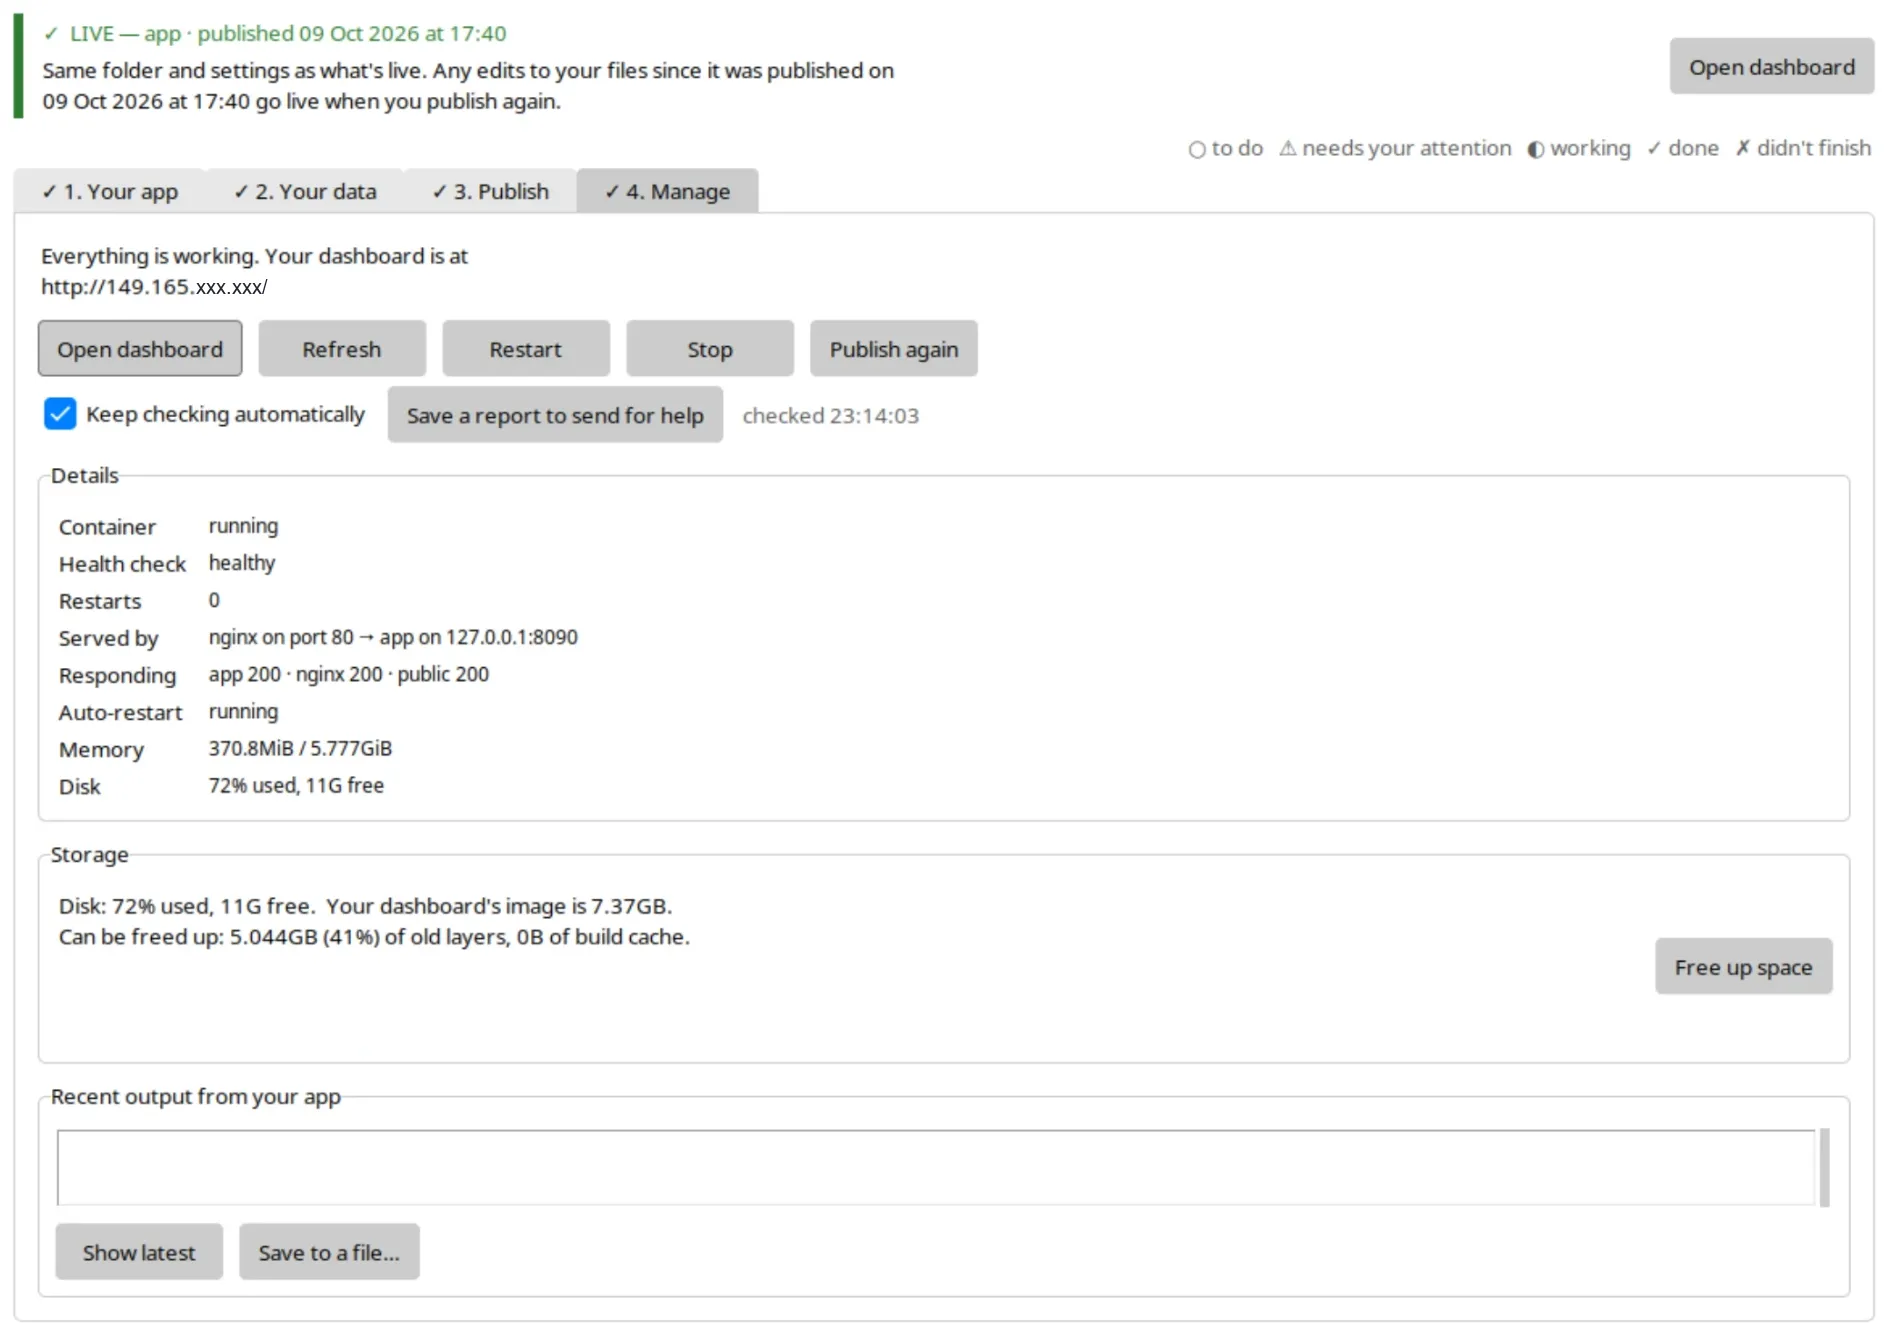
Long jobs and live apps fail in ordinary ways, so they’re built to recover: NAIP downloads resume where they stopped, the HLS pipeline works one tile at a time to keep disk use low, and deployed dashboards restart on a crash, with a watchdog for apps that stop answering.
Work should outlast my involvement: documentation sites for the BioSCape pipelines, a user guide for the Jetstream2 deployer, map styles embedded in the files they style, an ArcGIS Pro export for Stacked Terrain, and credit for the people whose work mine builds on.