Jetstream2 Dashboard Deploy
Get a research dashboard off a laptop and onto the open web, with no Docker knowledge required.
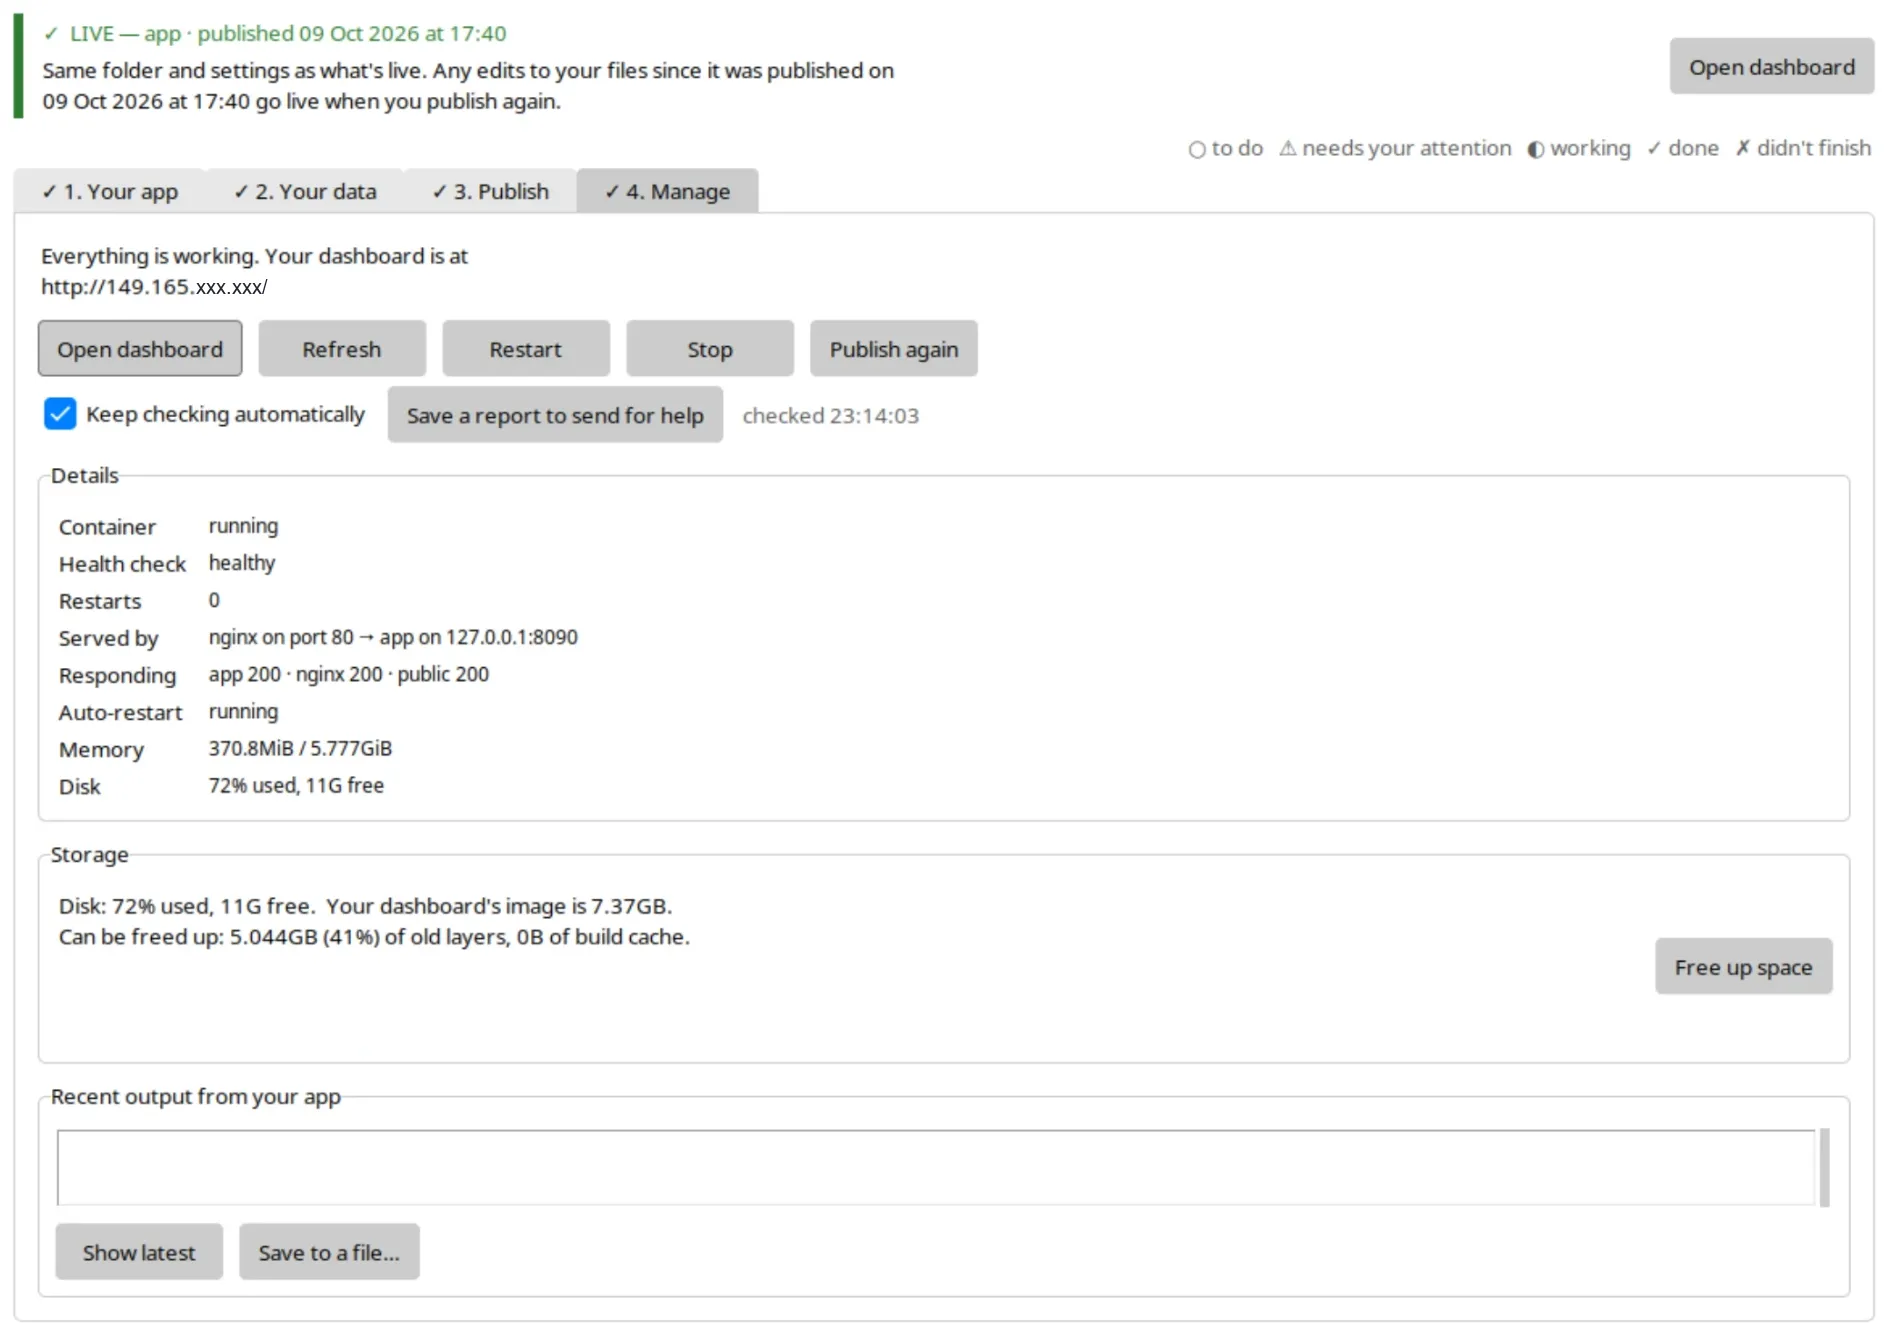
Researchers build dashboards that work on their laptops. Getting one online, permanently, means dealing with containers, reverse proxies, WSGI servers, TLS and a Linux server to keep alive. This project handles all of that for them on Jetstream2, the NSF-funded research cloud that’s free to U.S. researchers through ACCESS.
What it does
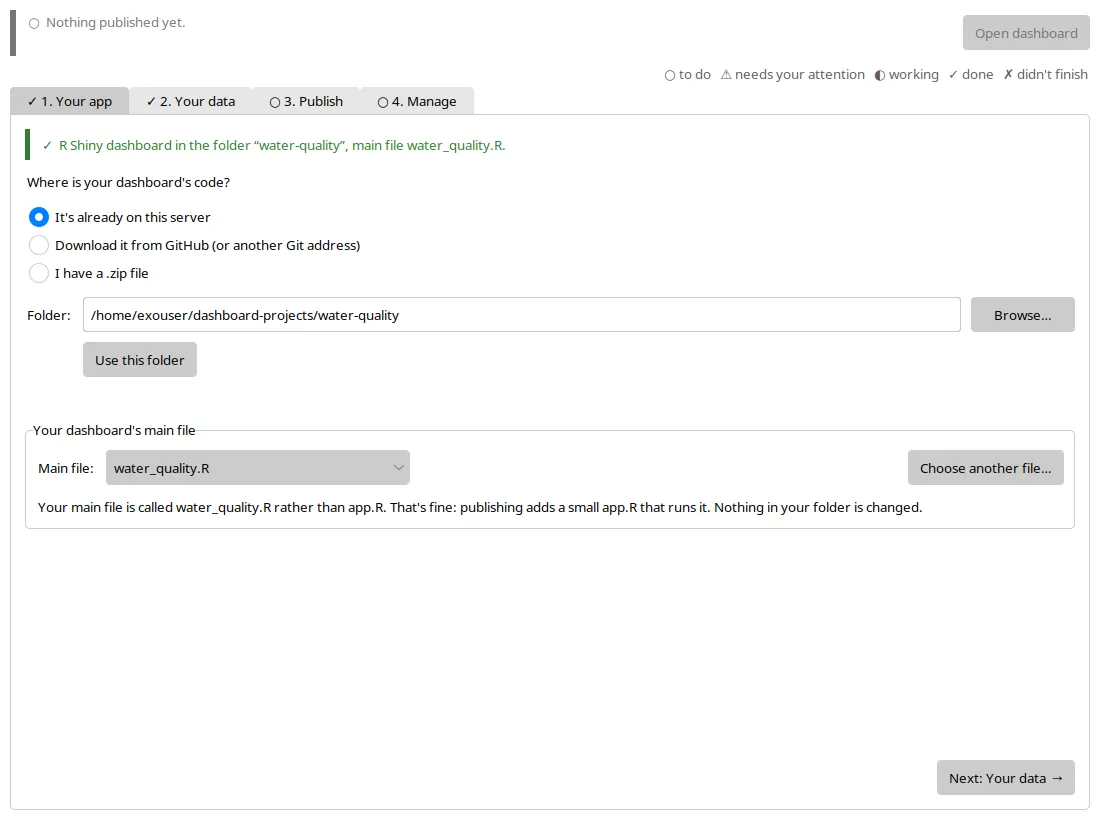
Step 1, Your app: it reads the code, reports the framework and finds the main file, even when it isn’t called app.R.
- Detects the framework from the code itself. It reads imports rather than guessing from filenames, and supports R Shiny, Plotly Dash, Python Shiny and Streamlit.
- Flags laptop-only habits before publishing: hard-coded local paths,
setwd()and filename case mismatches, with file and line numbers. - Handles dependencies. It generates a missing
renv.lockand switches to a GDAL-ready base image when it sees a geospatial R project. - Keeps big data separate. Small files ship with the app, while large datasets mount from a storage volume, so updating data takes a restart, not a rebuild.
- Production web serving: nginx with WebSockets, gzip, rate limiting, a maintenance page and TLS.
- Stays up: restart on crash, plus a watchdog that catches apps that are alive but no longer answering.
- No terminal needed. A desktop app walks researchers through each step and is a thin front end over the same scripts.
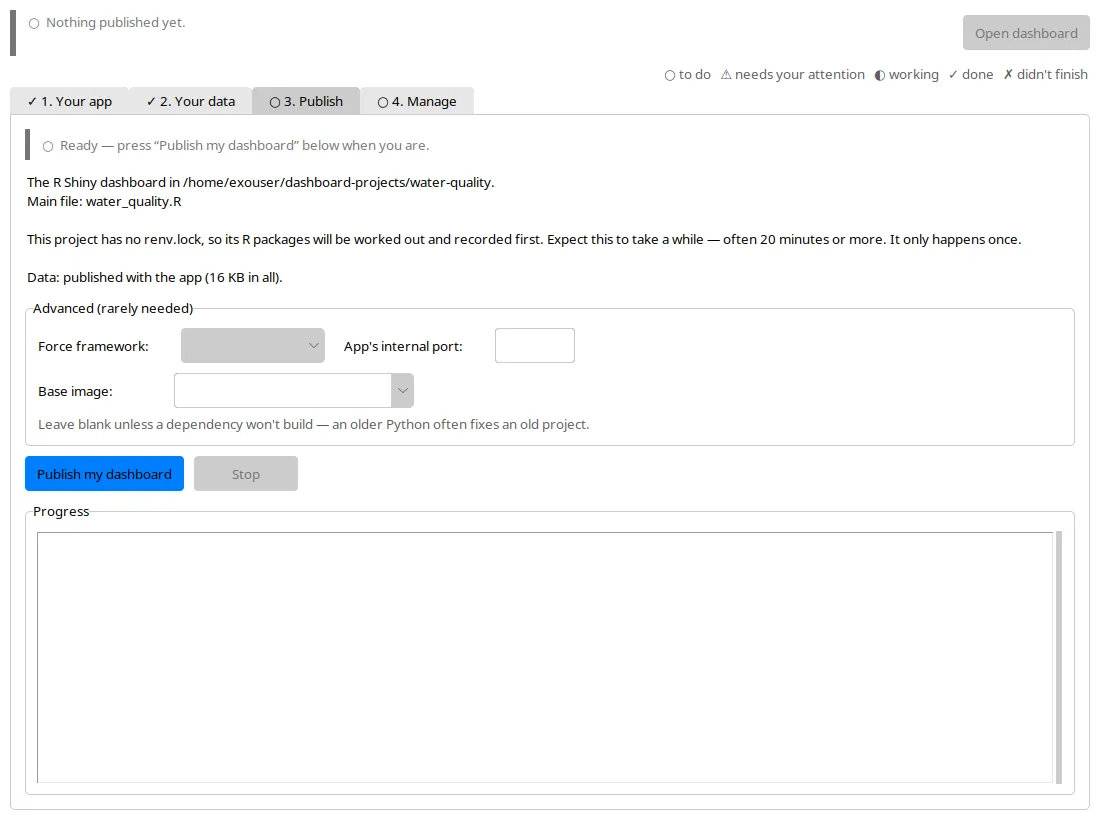
Step 3, Publish: a plain-language readiness summary, including how long a first build will take, before anything is deployed. Step 4, Manage, at the top of this page, shows the dashboard live: container, health check, nginx and public responses, memory and disk.
It’s the deployment path behind the BioSCape Phenology Explorer.