A good map makes a complicated story clear at a glance. These are maps I designed for a general audience, followed by maps from my technical projects. Click any map to open it at full size.
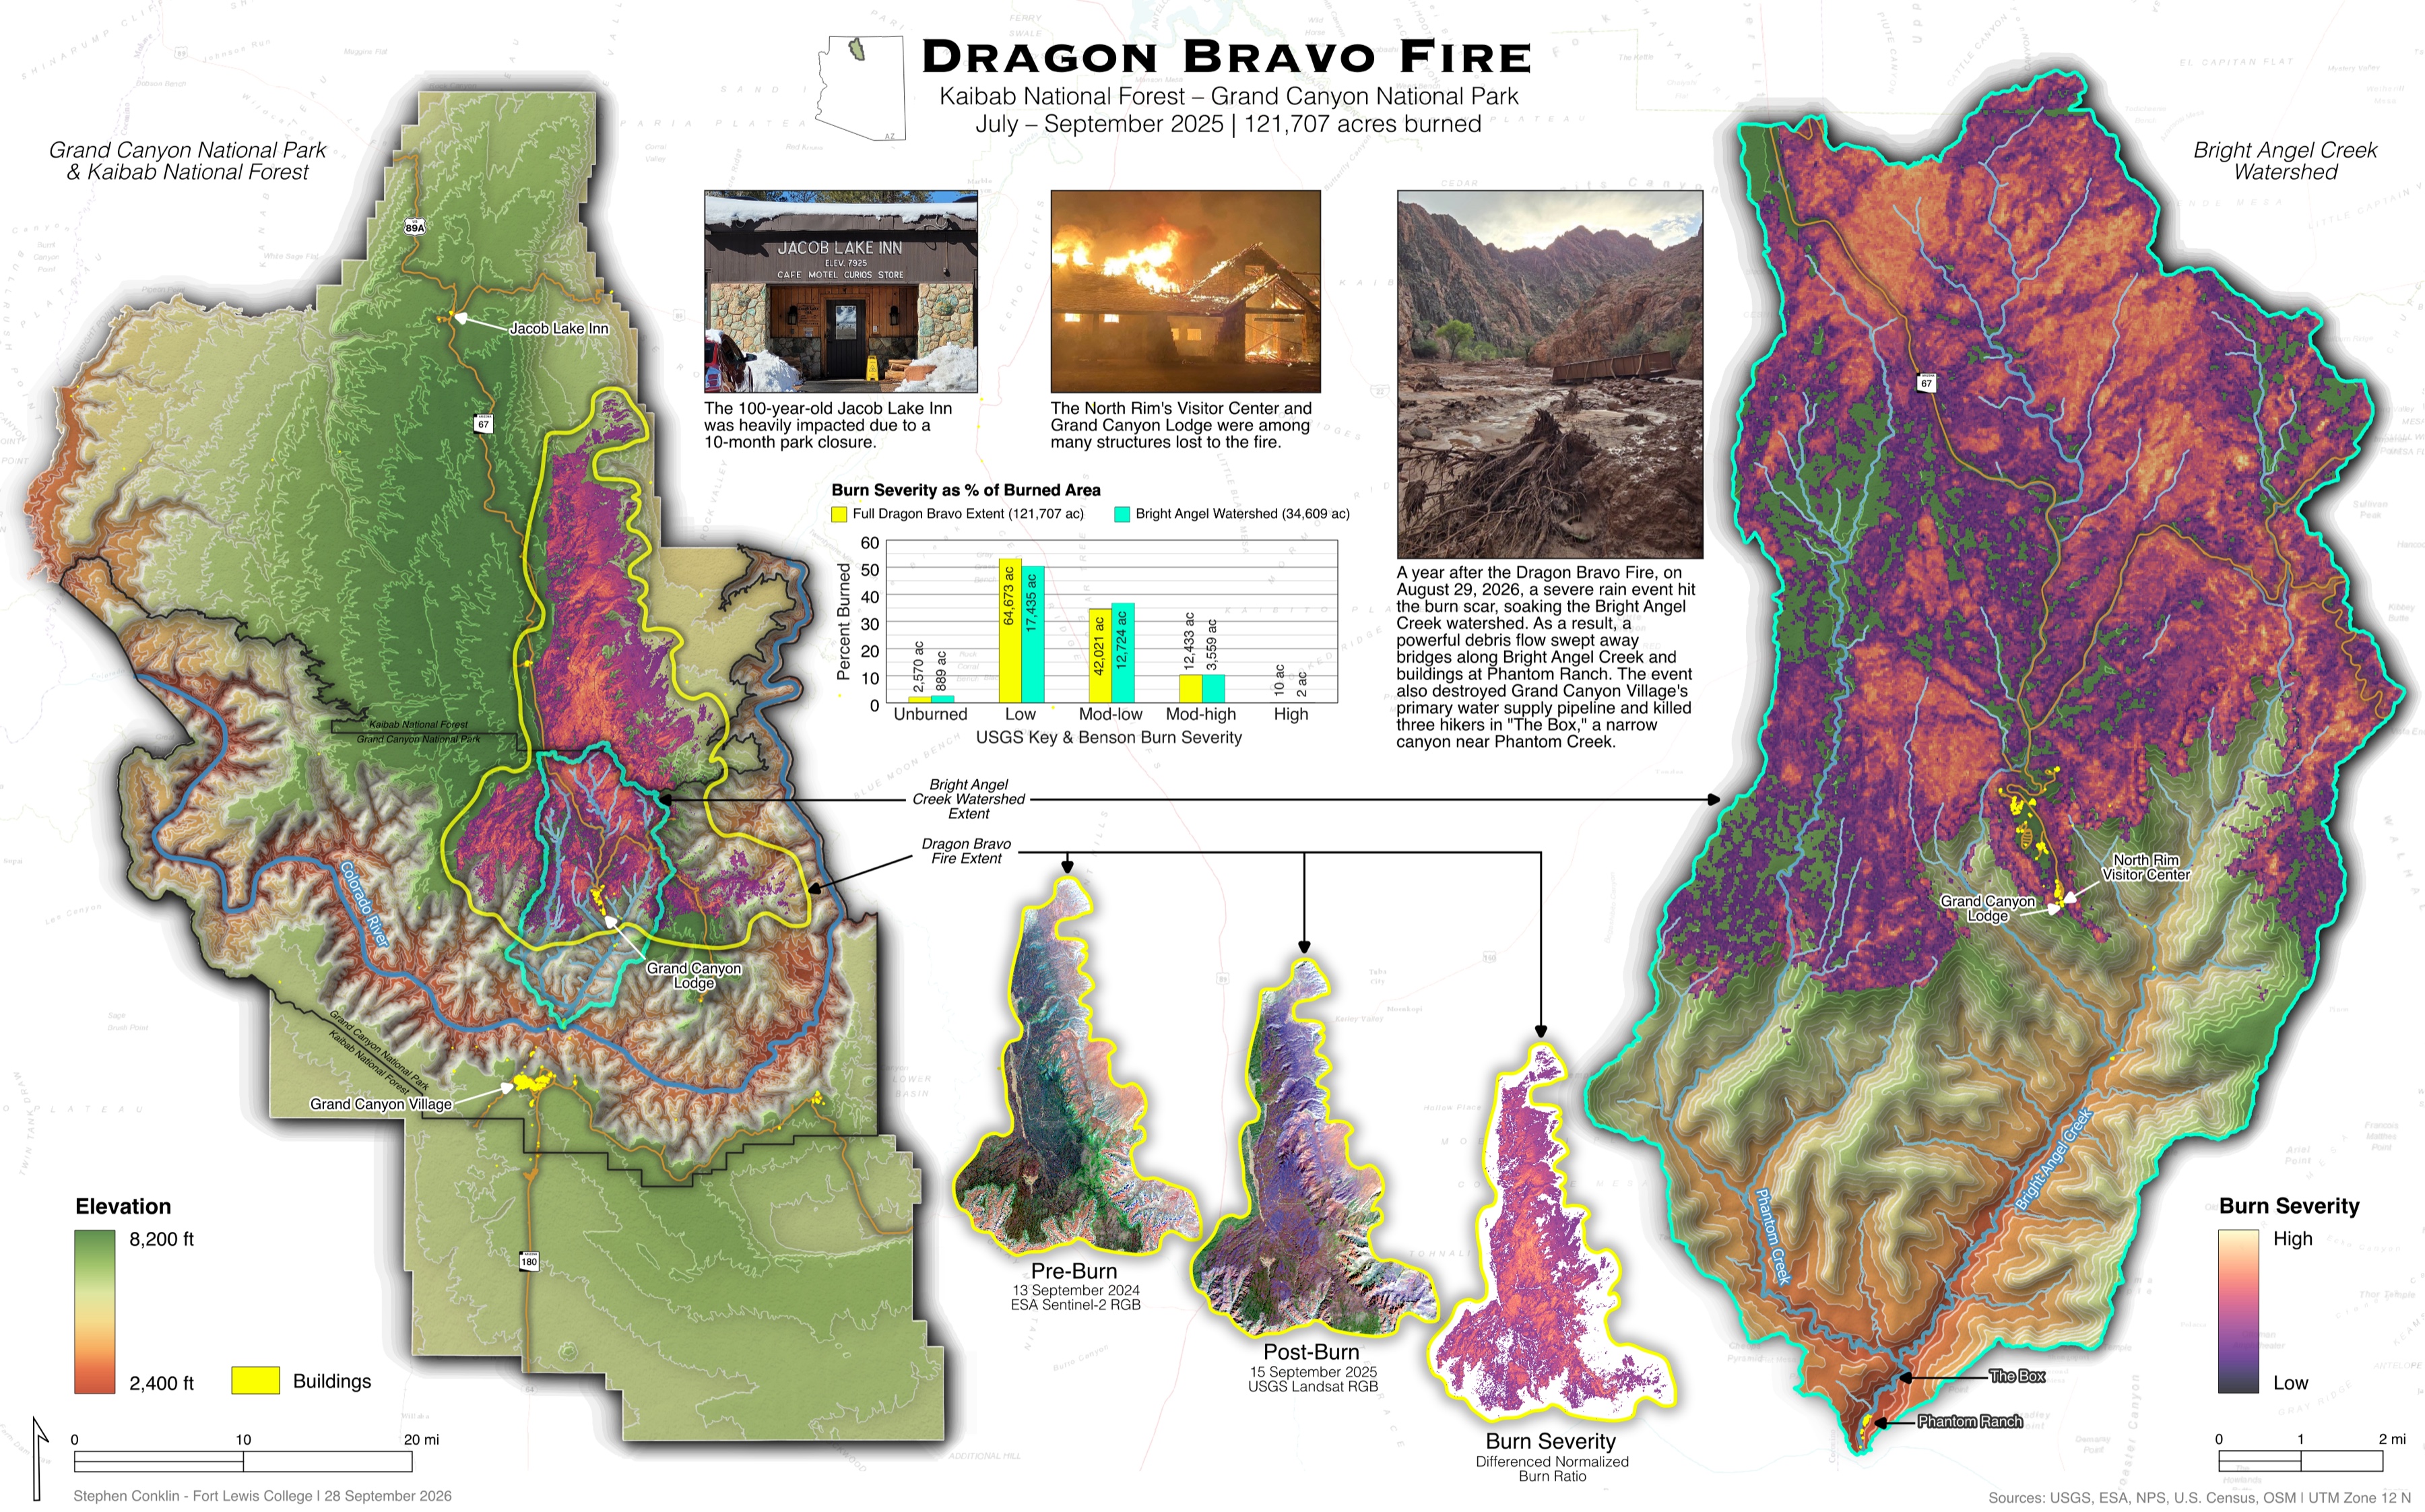
Dragon Bravo Fire
Grand Canyon National Park & Kaibab National Forest, 2025
A one-page story of the fire that burned 121,707 acres on the Grand Canyon’s North Rim: where it spread, how severely it burned, the landmarks it destroyed, and the debris flow that tore through Bright Angel Creek a year later.
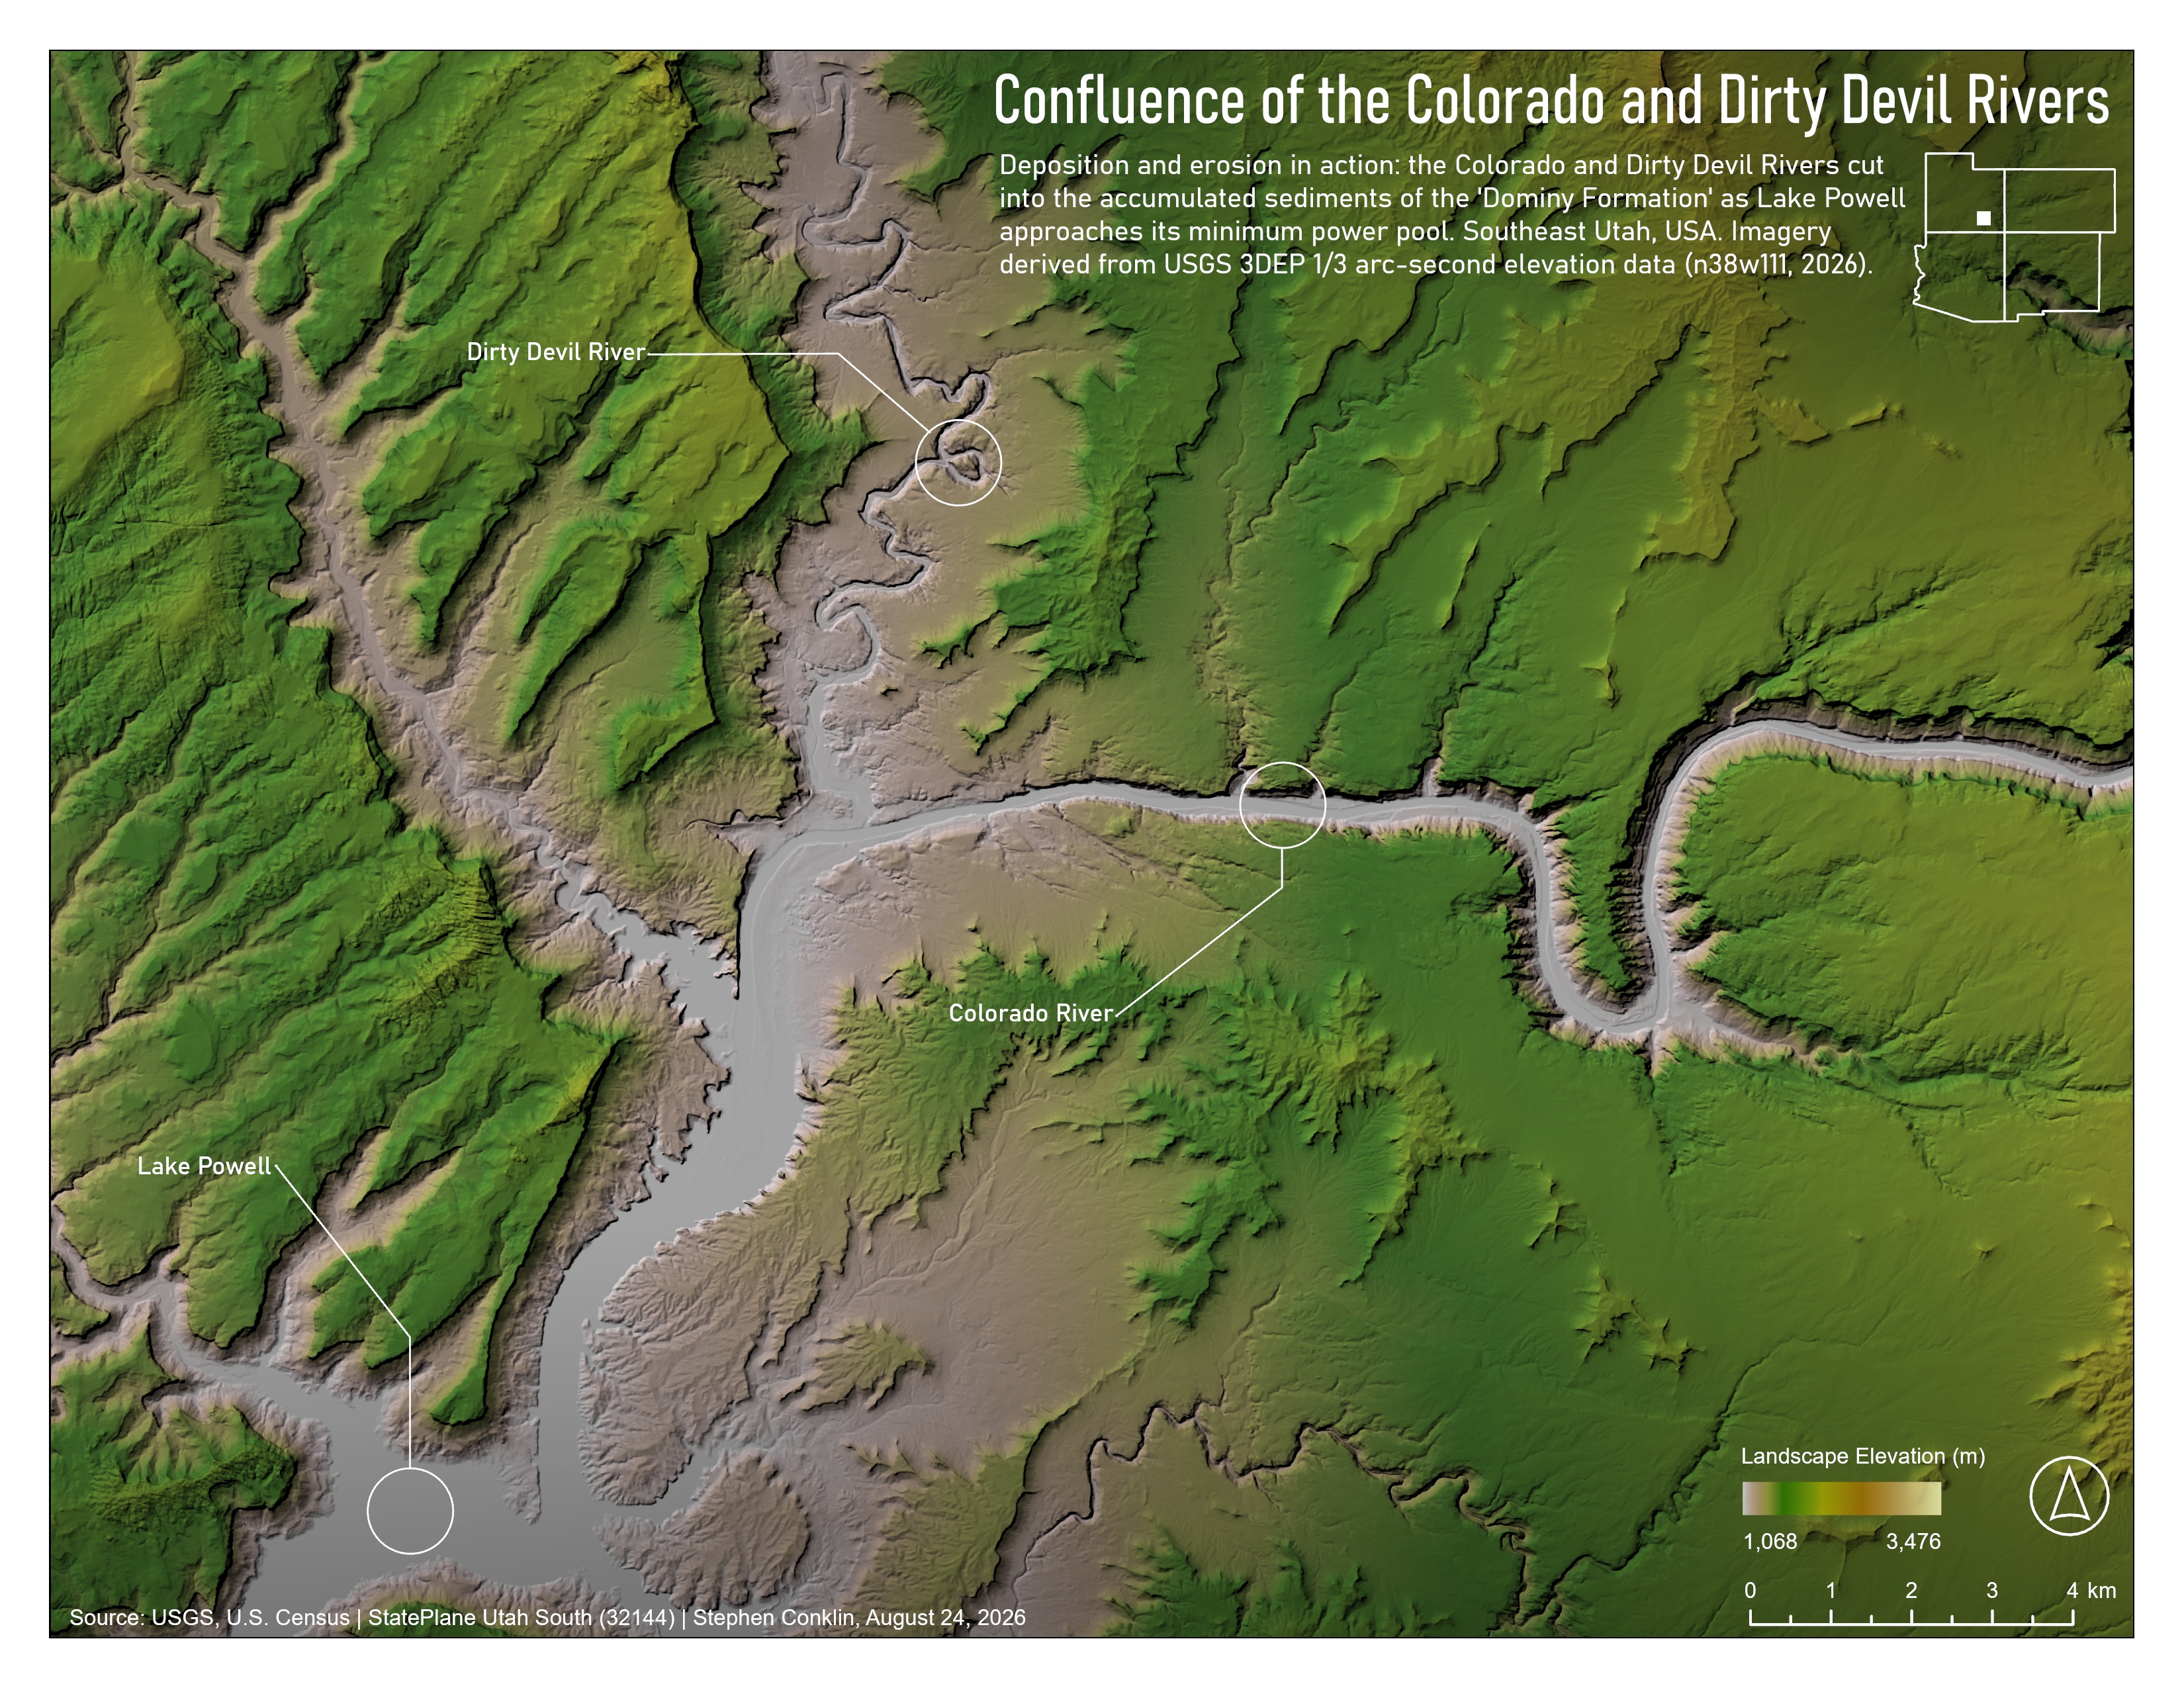
As Lake Powell drops toward its minimum power pool, the Colorado and Dirty Devil Rivers are cutting back down through decades of sediment the reservoir left behind, nicknamed the “Dominy Formation.” A shaded-relief elevation map of erosion and deposition in action.
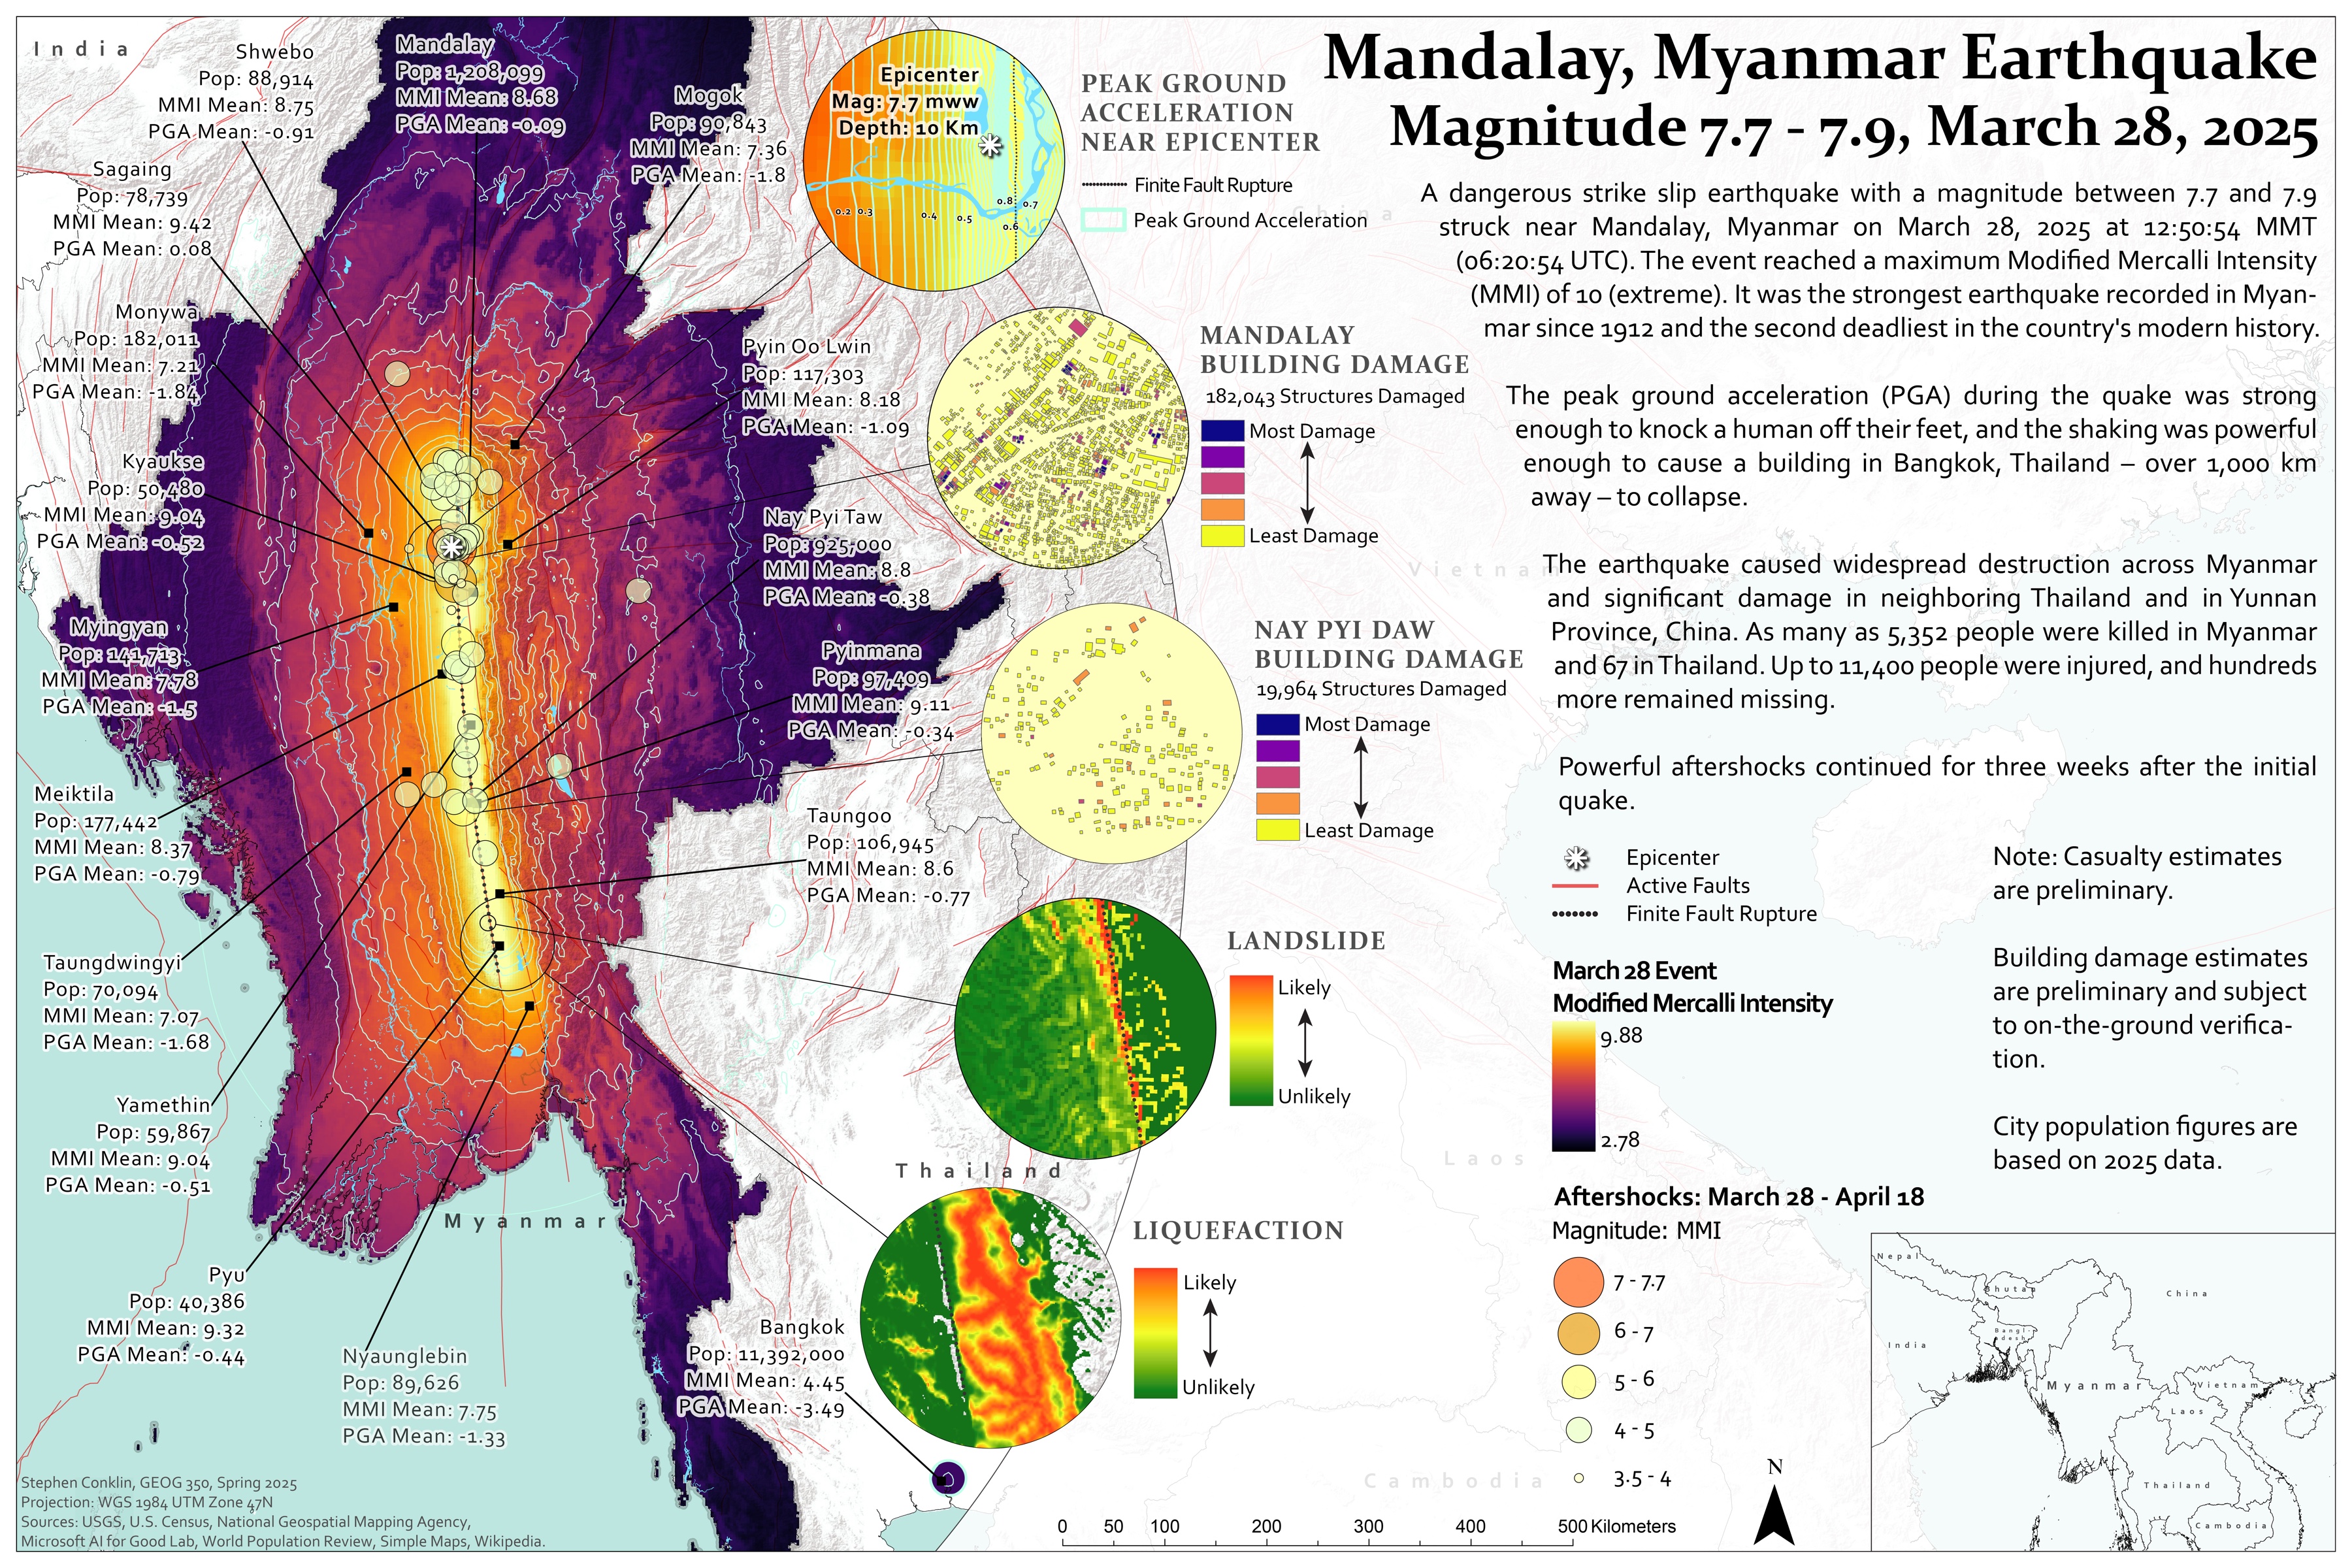
The strongest earthquake recorded in Myanmar since 1912, mapped for a general audience: how hard the ground shook, which cities felt it, how many buildings were damaged in Mandalay and Nay Pyi Taw, and where landslides and liquefaction were most likely.
Shaking intensity (MMI)
Building damage
Landslide & liquefaction risk
Population data
Fort Lewis College · GEOG 350 Vector GIS final project · Spring 2025
Coming soon
New map layouts in preparation.
Map in preparation
Professional map layout
In preparation
Map in preparation
Professional map layout
In preparation
Maps from my projects
Satellite mosaics, burn severity, terrain art and drone change detection. 1 more are in preparation.
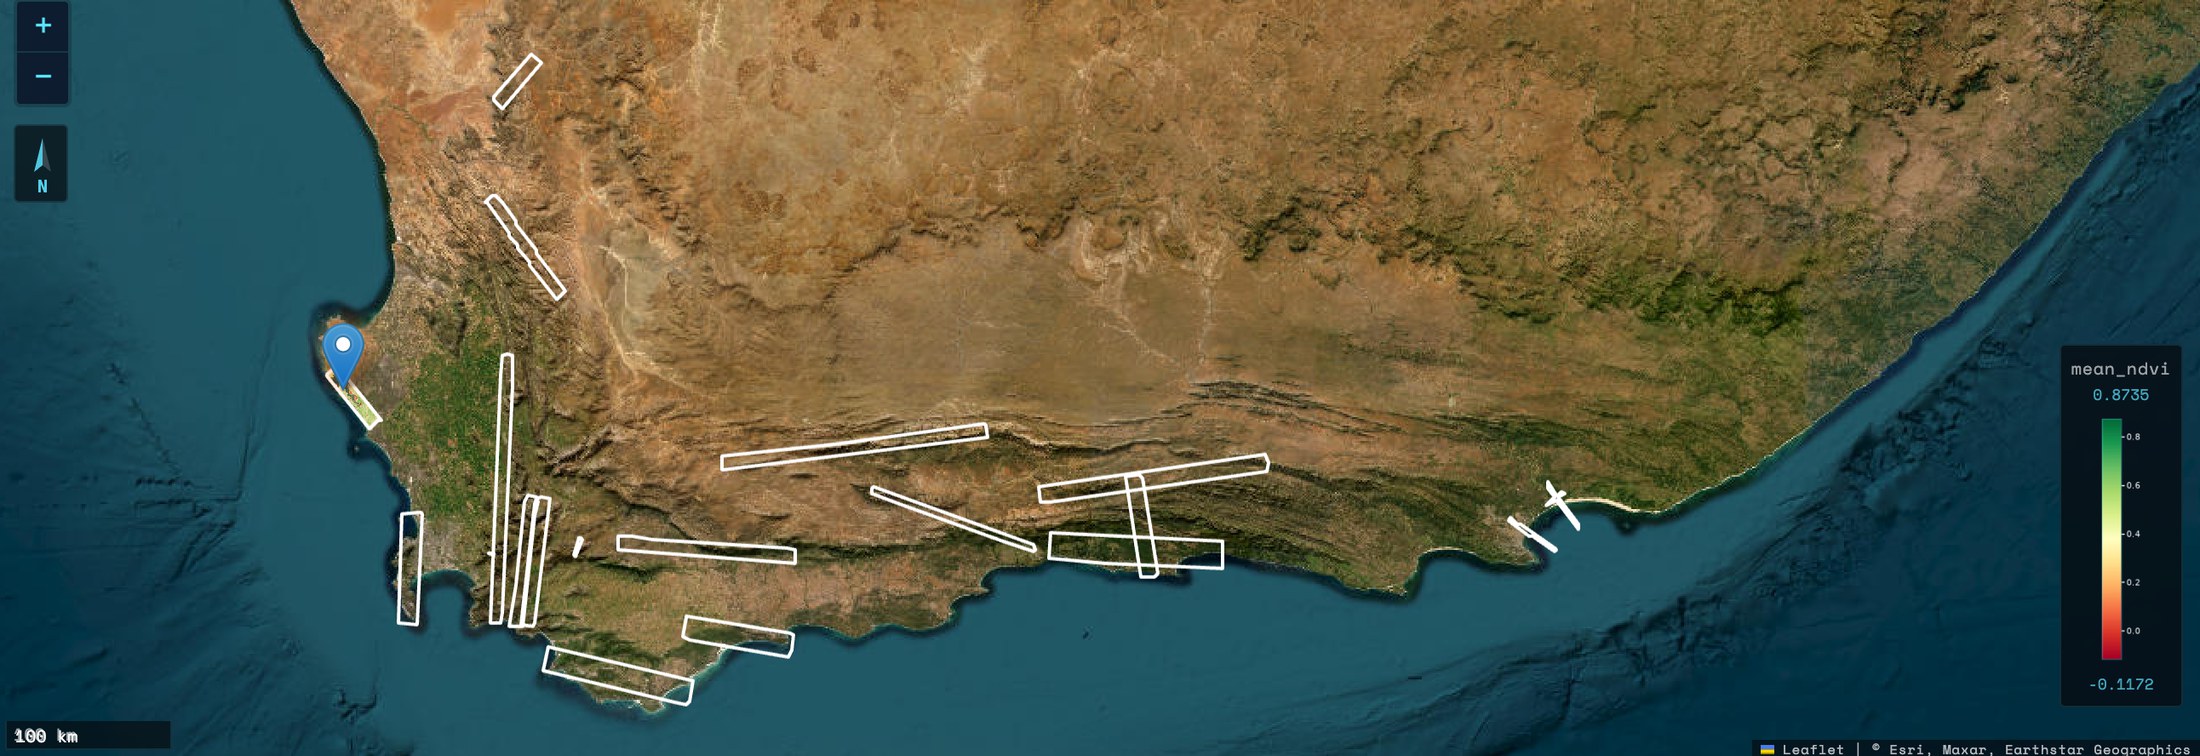
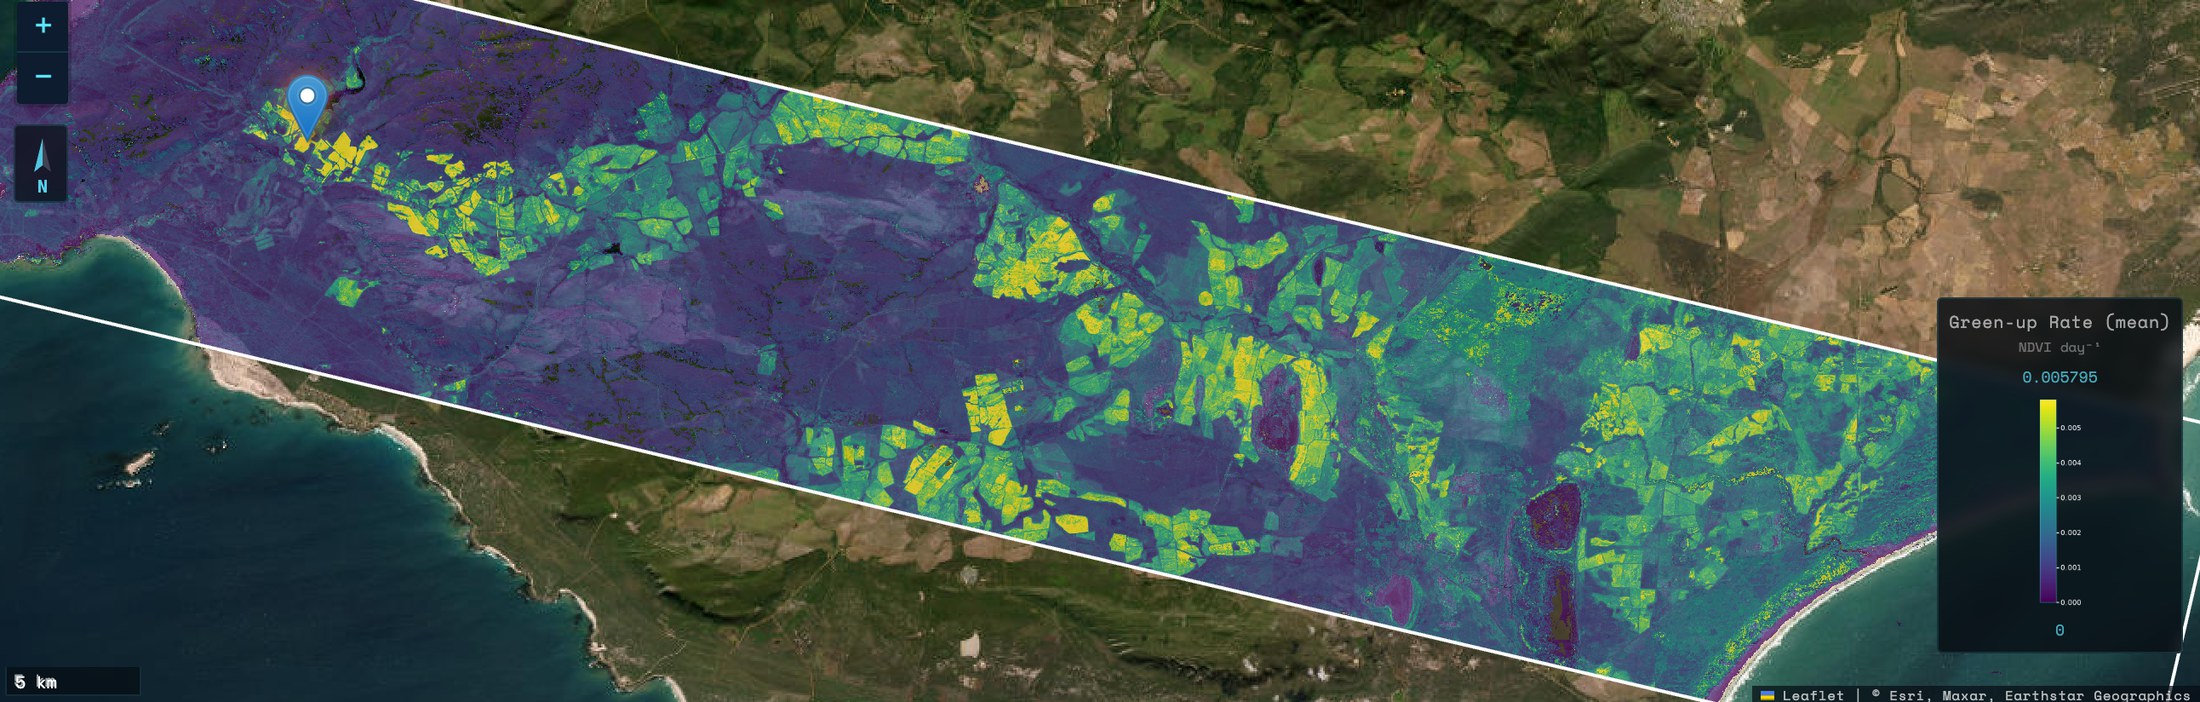
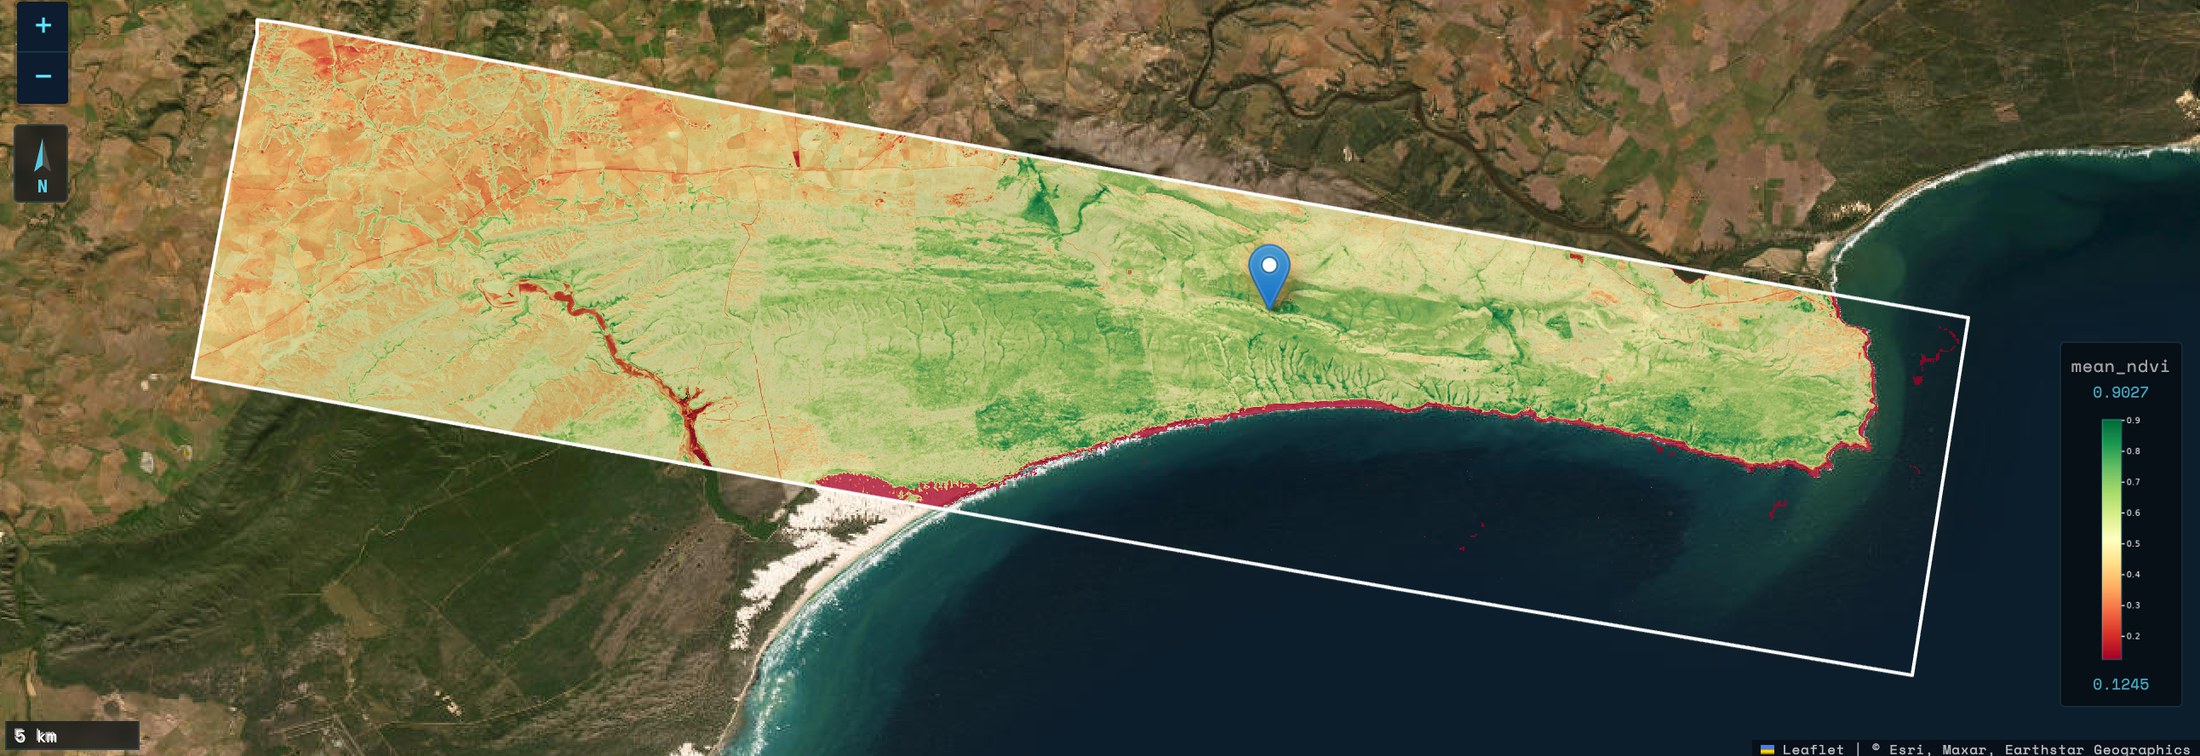
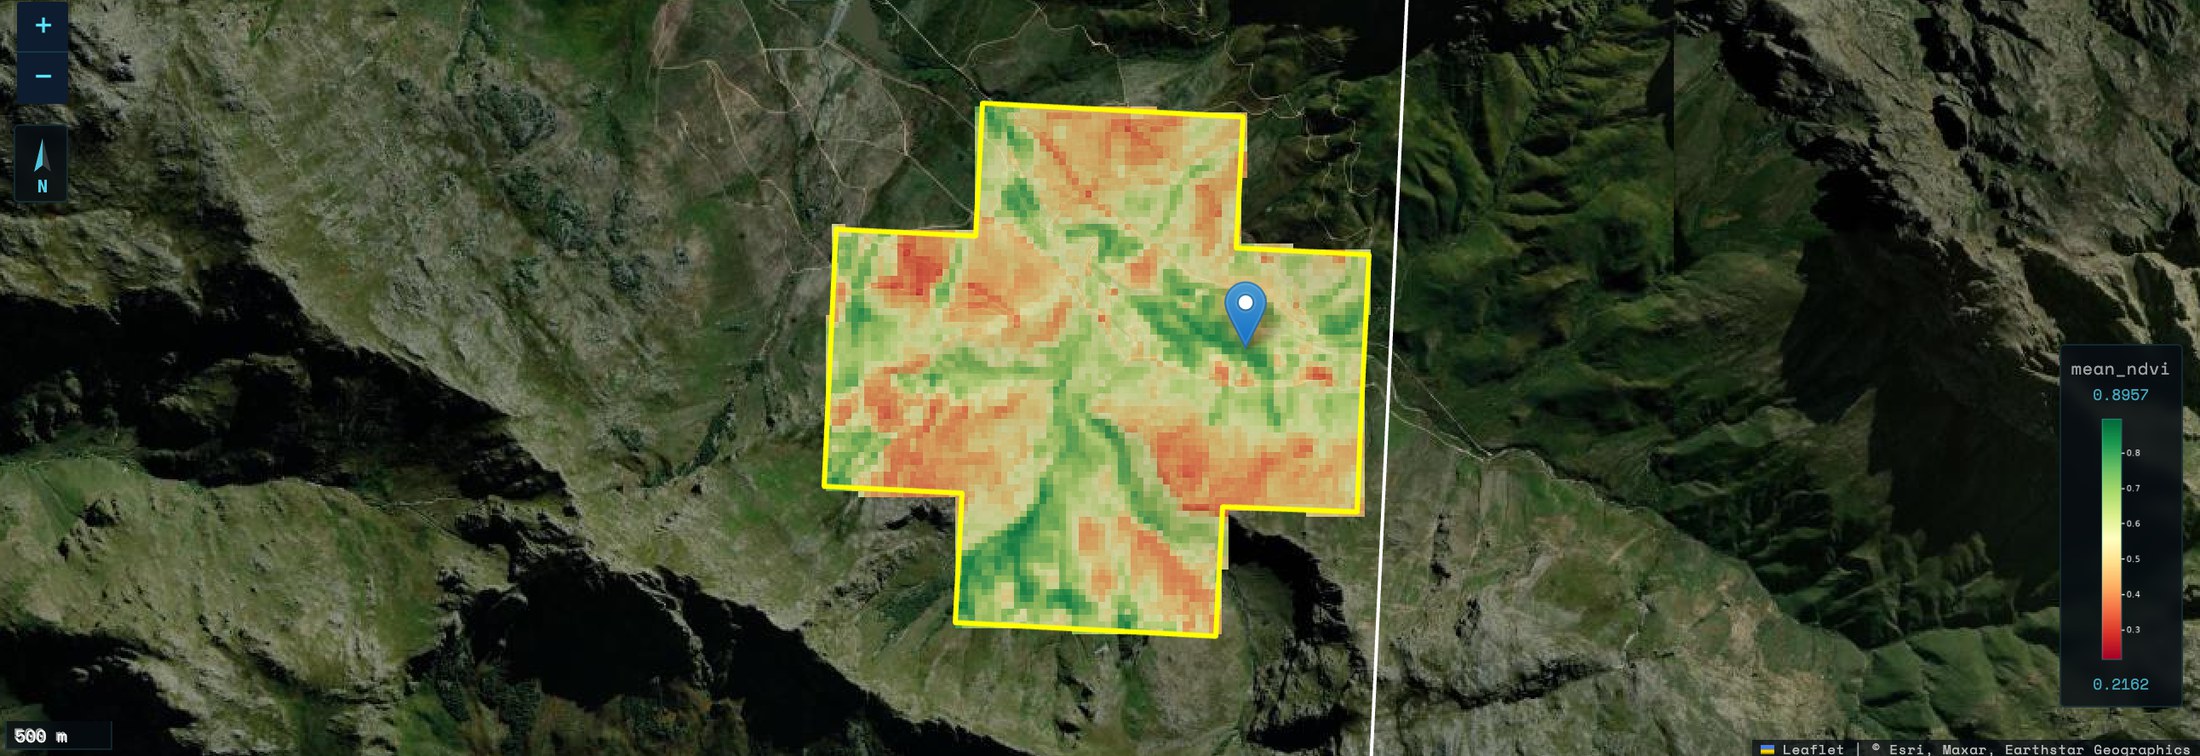
LVIS flight boxes over the Cape Floristic RegionThe study regions, selectable in the dashboard, on a satellite basemap.Green-up rate, flight box G5_5How fast vegetation greens up each season, mapped pixel by pixel.Mean NDVI, flight box G5_6Average vegetation greenness along the south coast, 2016–2025.Mean NDVI, region G5_25Fine-scale vegetation patterns in mountain terrain.
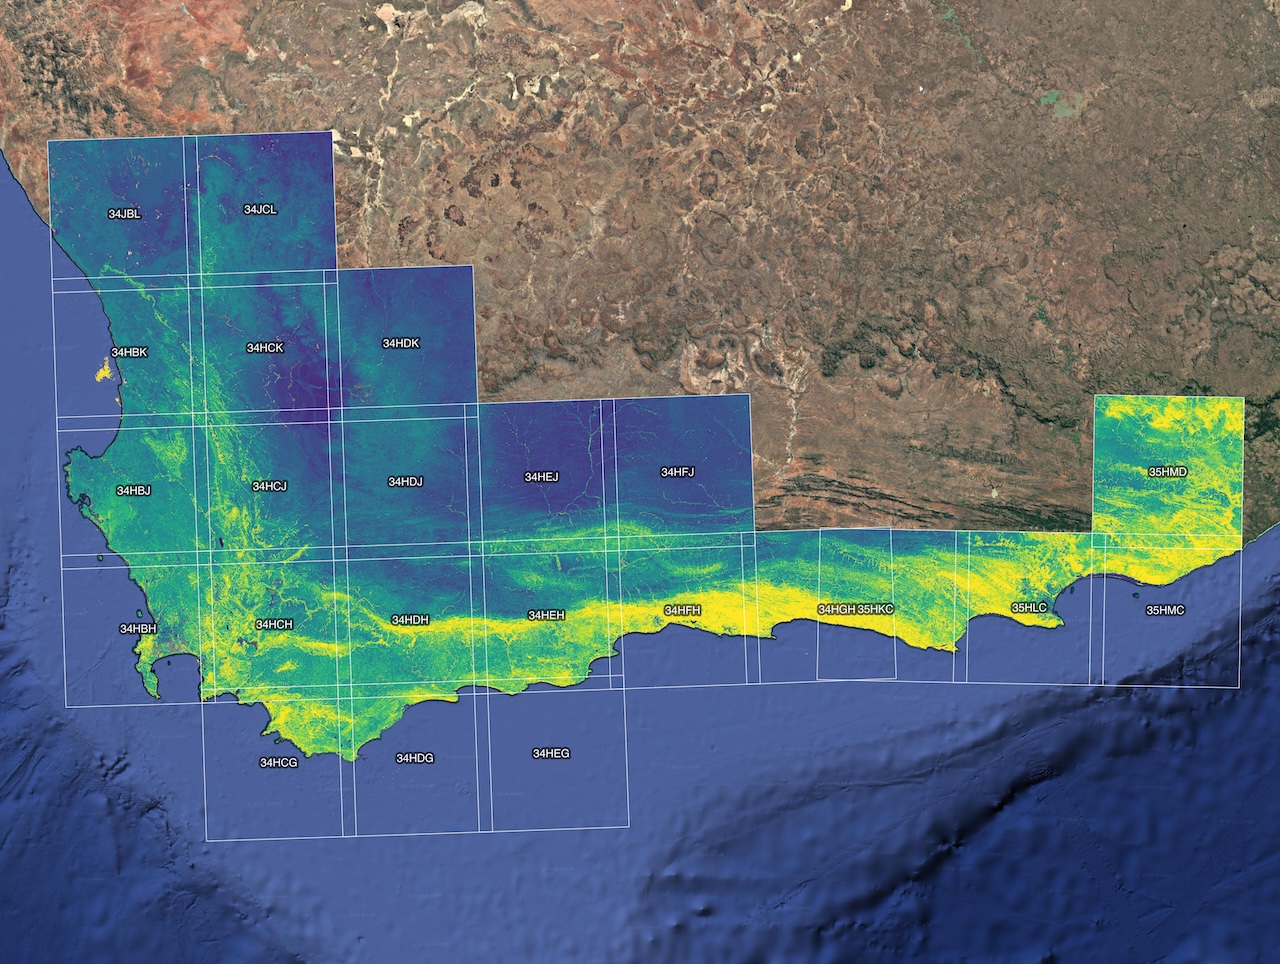
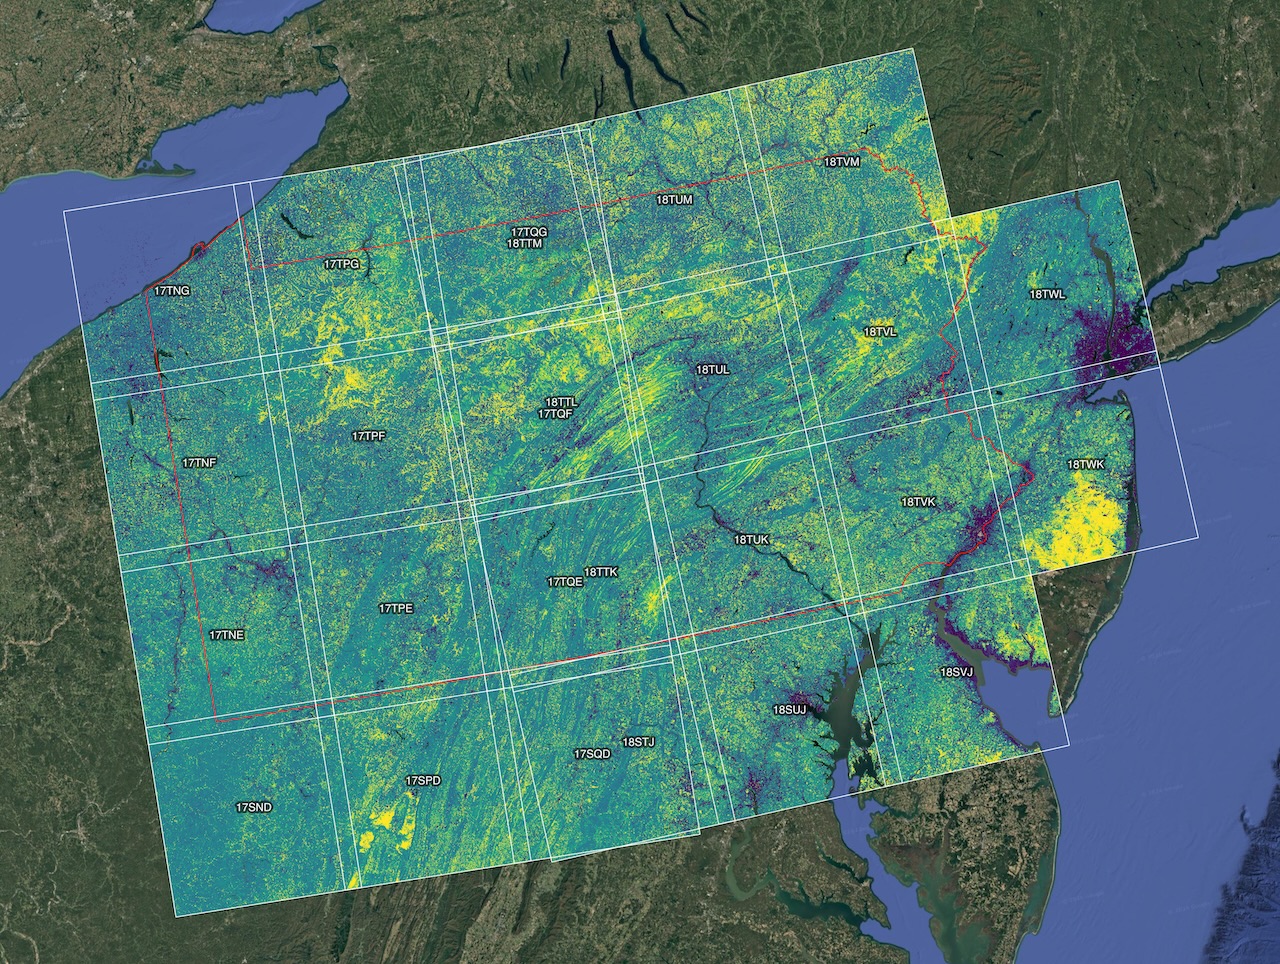
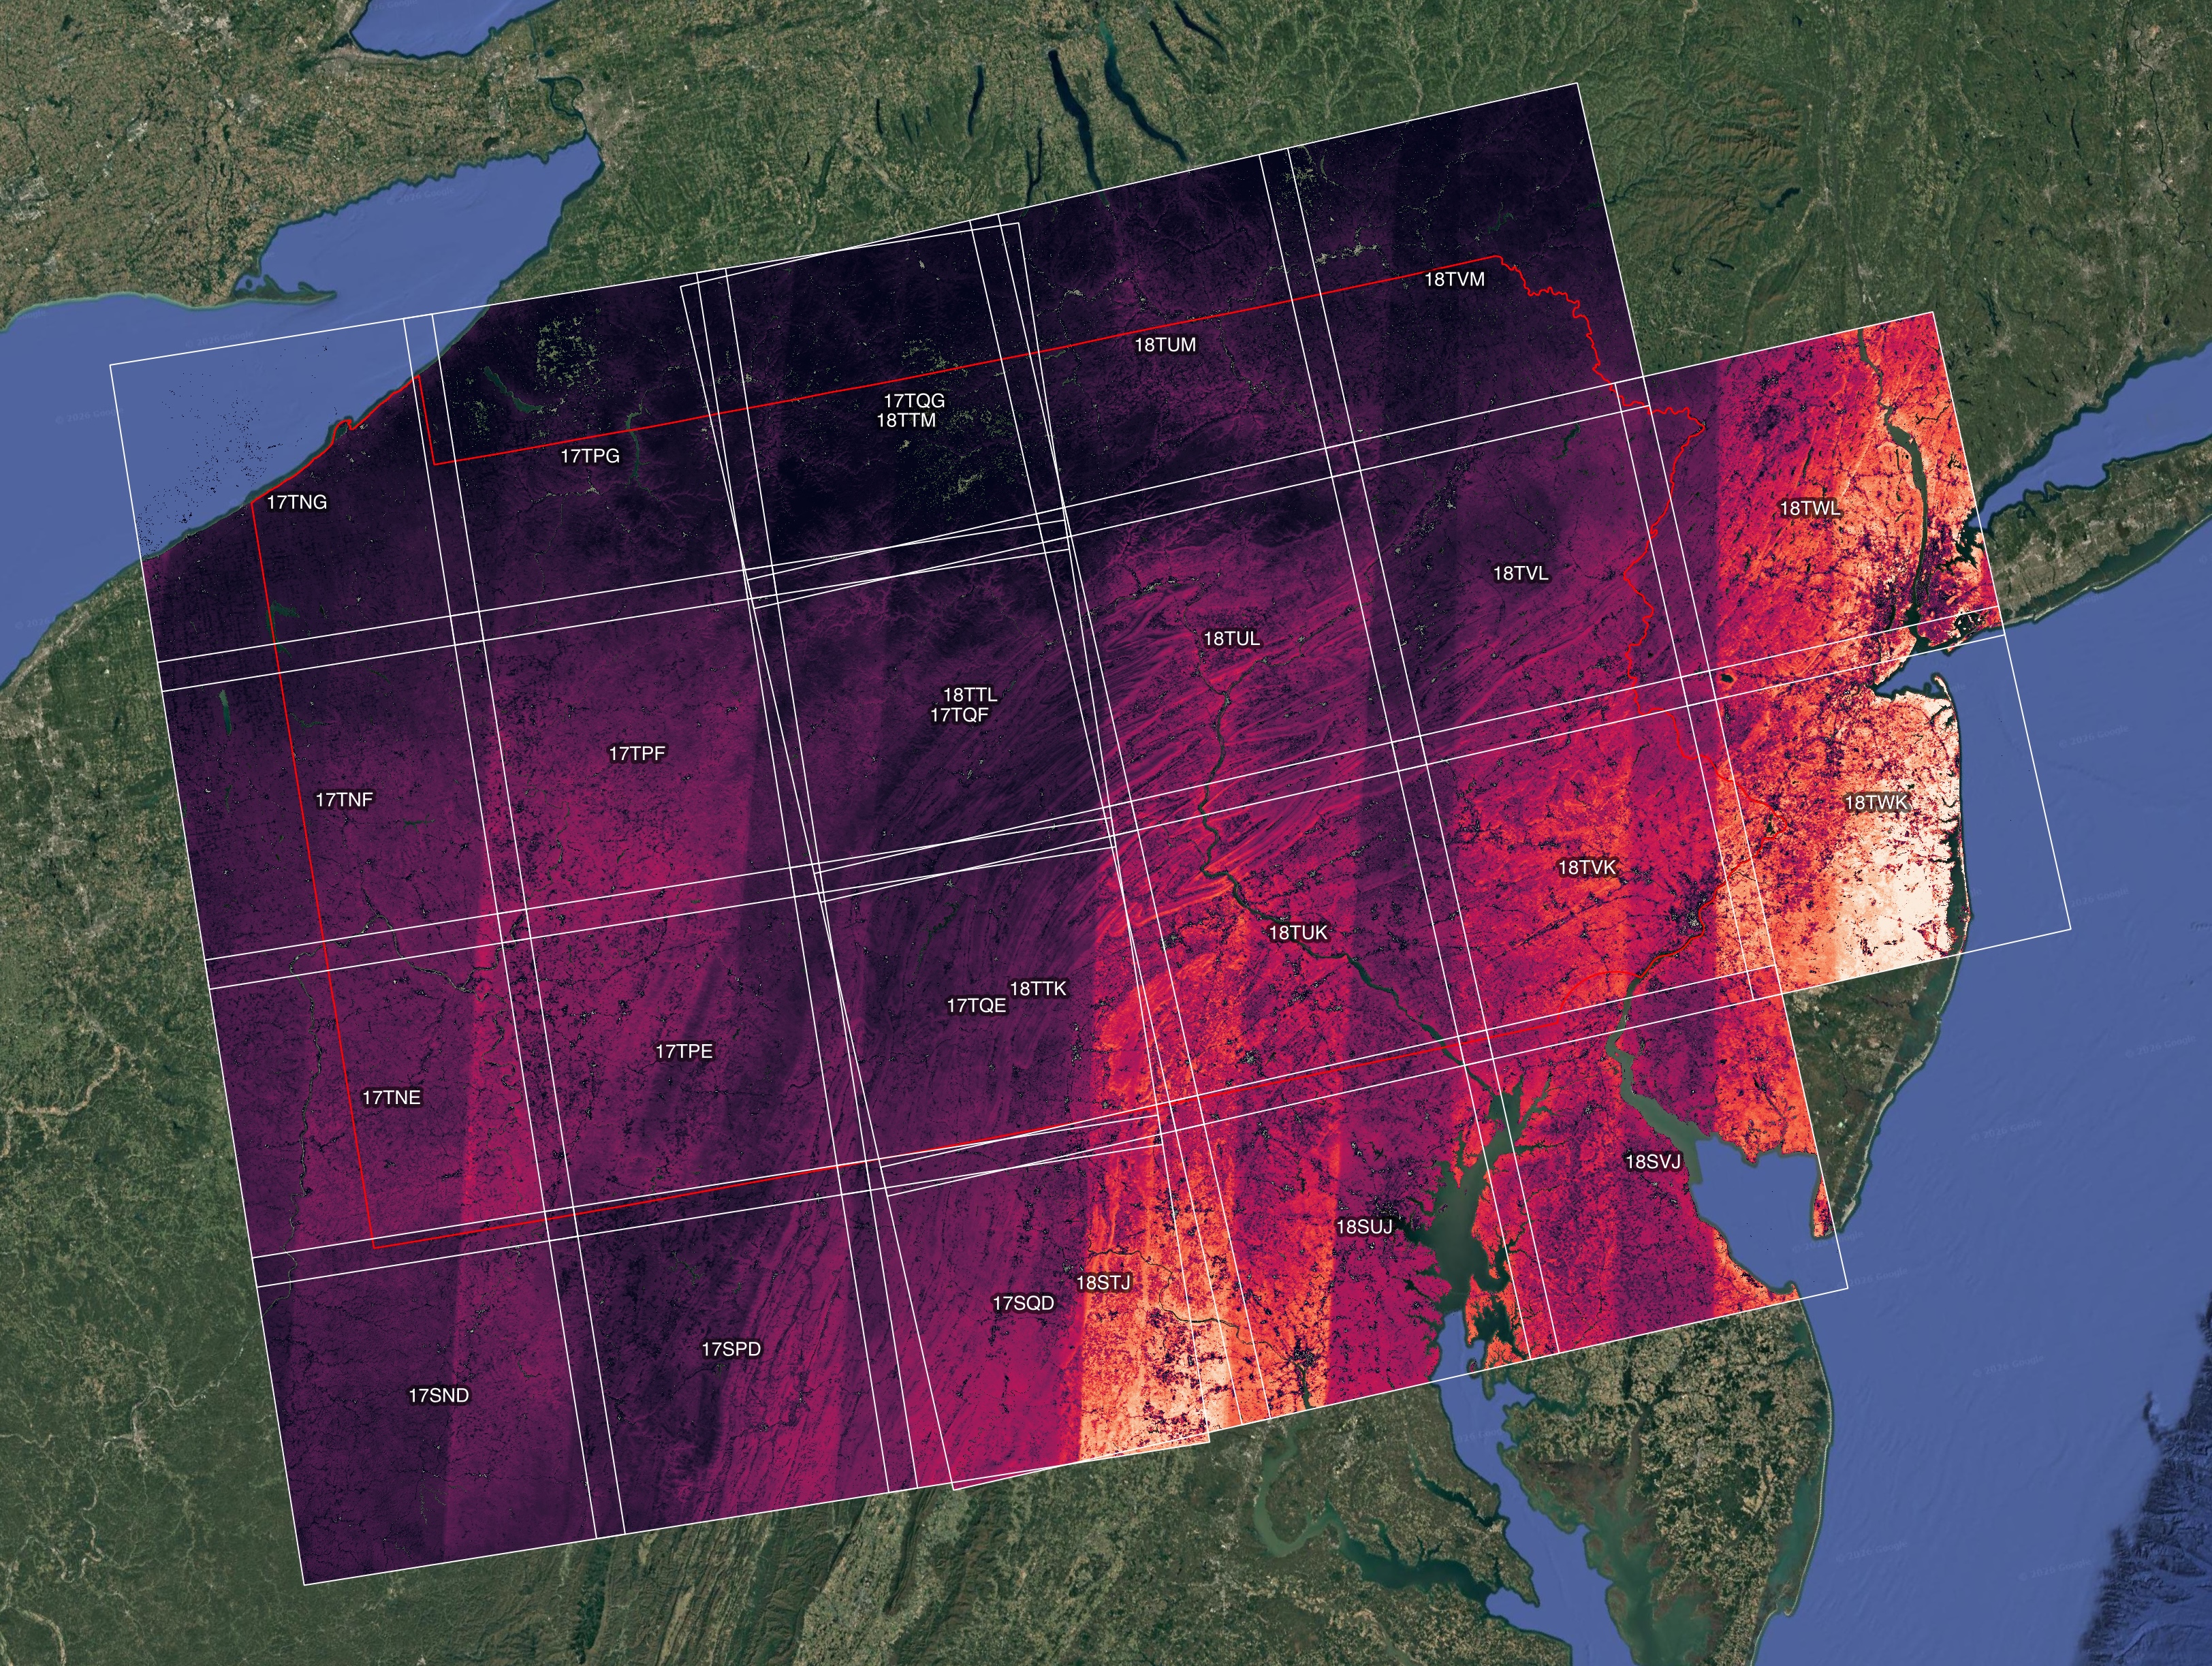
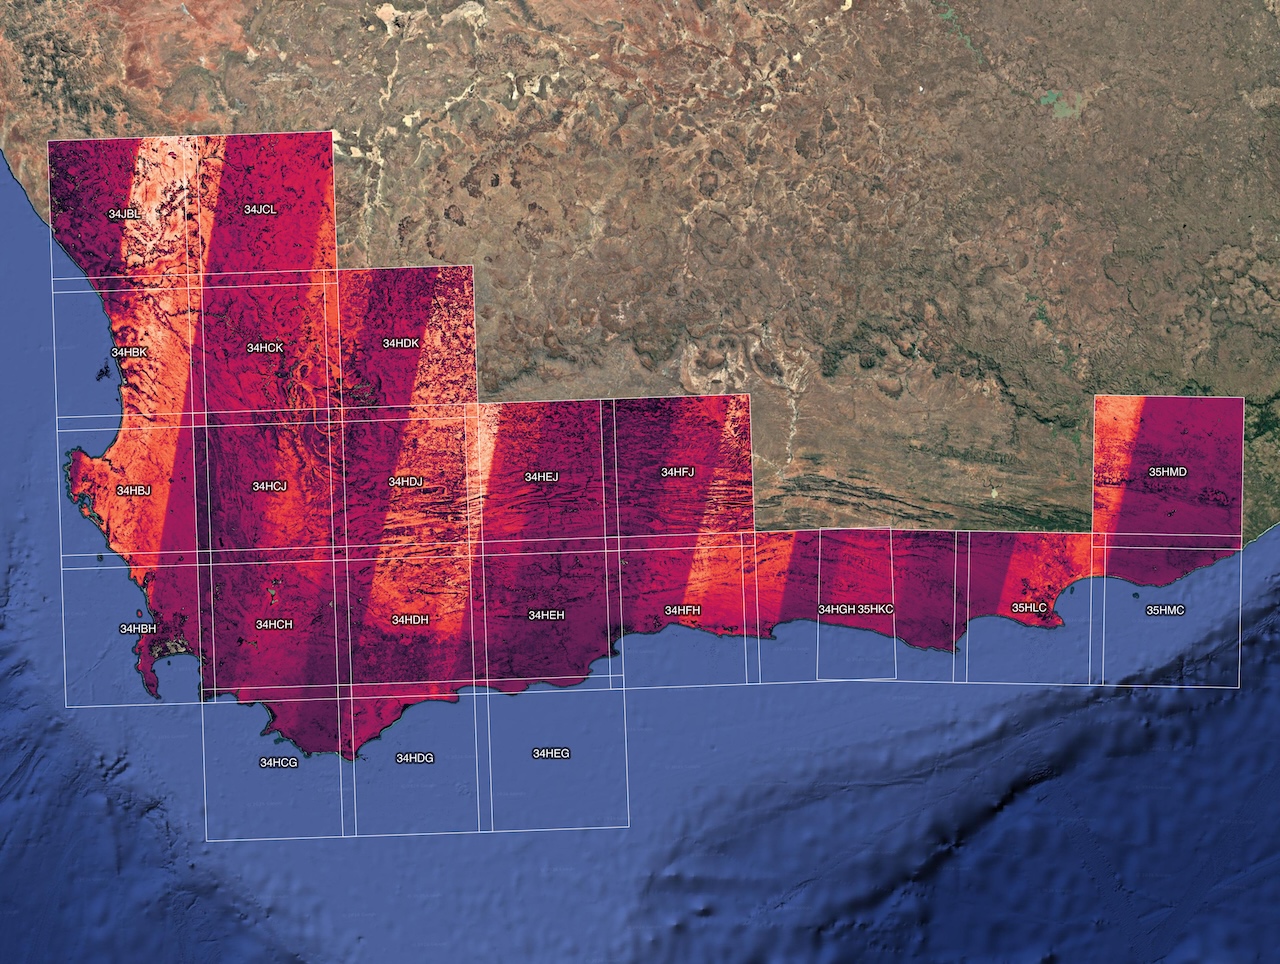
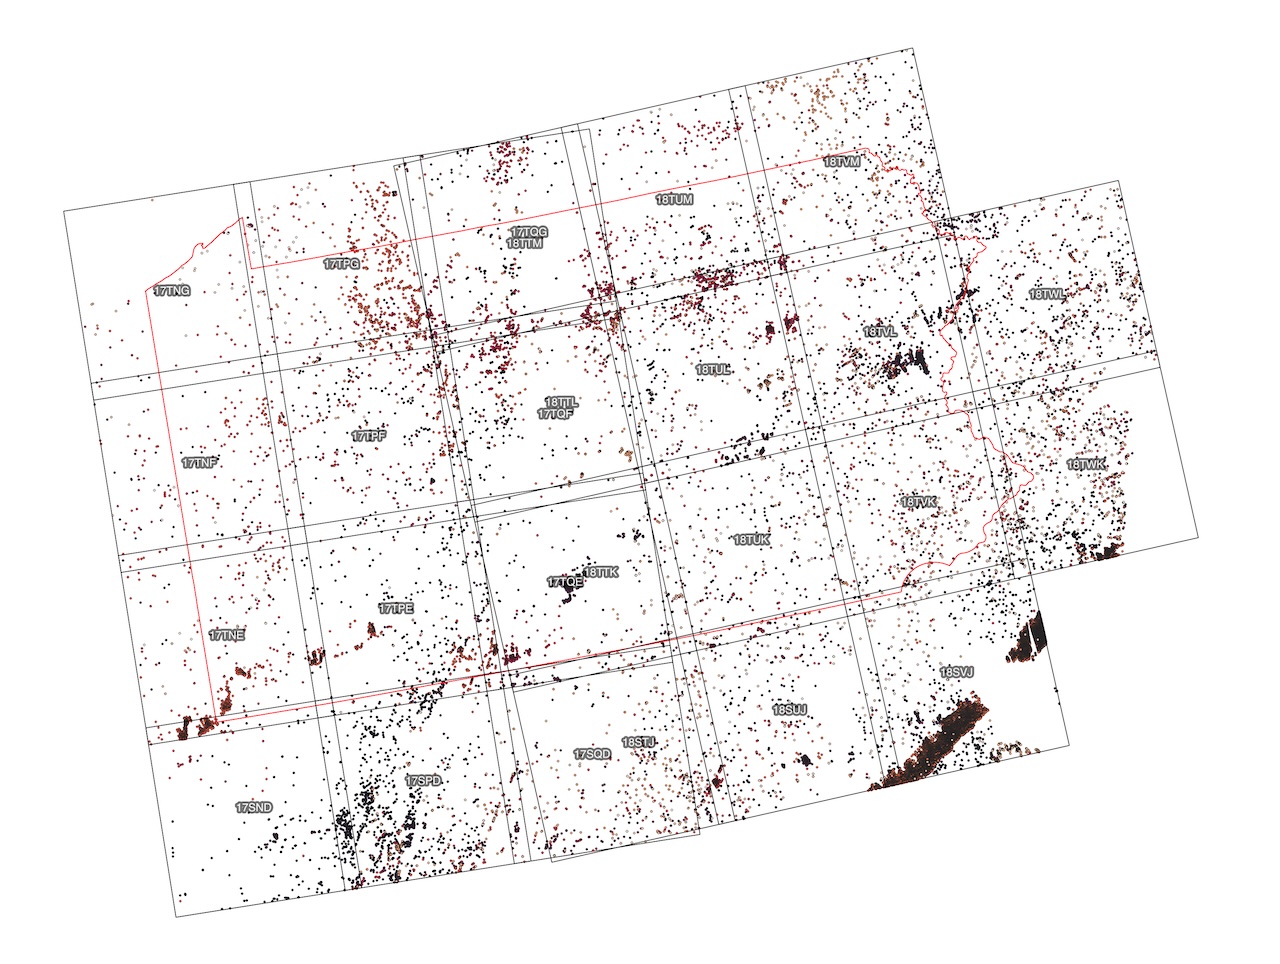
NDVI temporal mean, South Africa (2015–2025)BioSCape study area. EPSG:9221, Viridis.NDVI “leaf-off” temporal mean, Pennsylvania (2015–2021)Mountain laurel / rhododendron study area. EPSG:6350, Viridis.Valid observations, PennsylvaniaCount of cloud-free NDVI observations per pixel. Lighter = more observations.Valid observations, South AfricaCount of cloud-free NDVI observations per pixel. Lighter = more observations.NDVI outlier points, PennsylvaniaAnomalous pixels exported to a searchable GeoPackage.
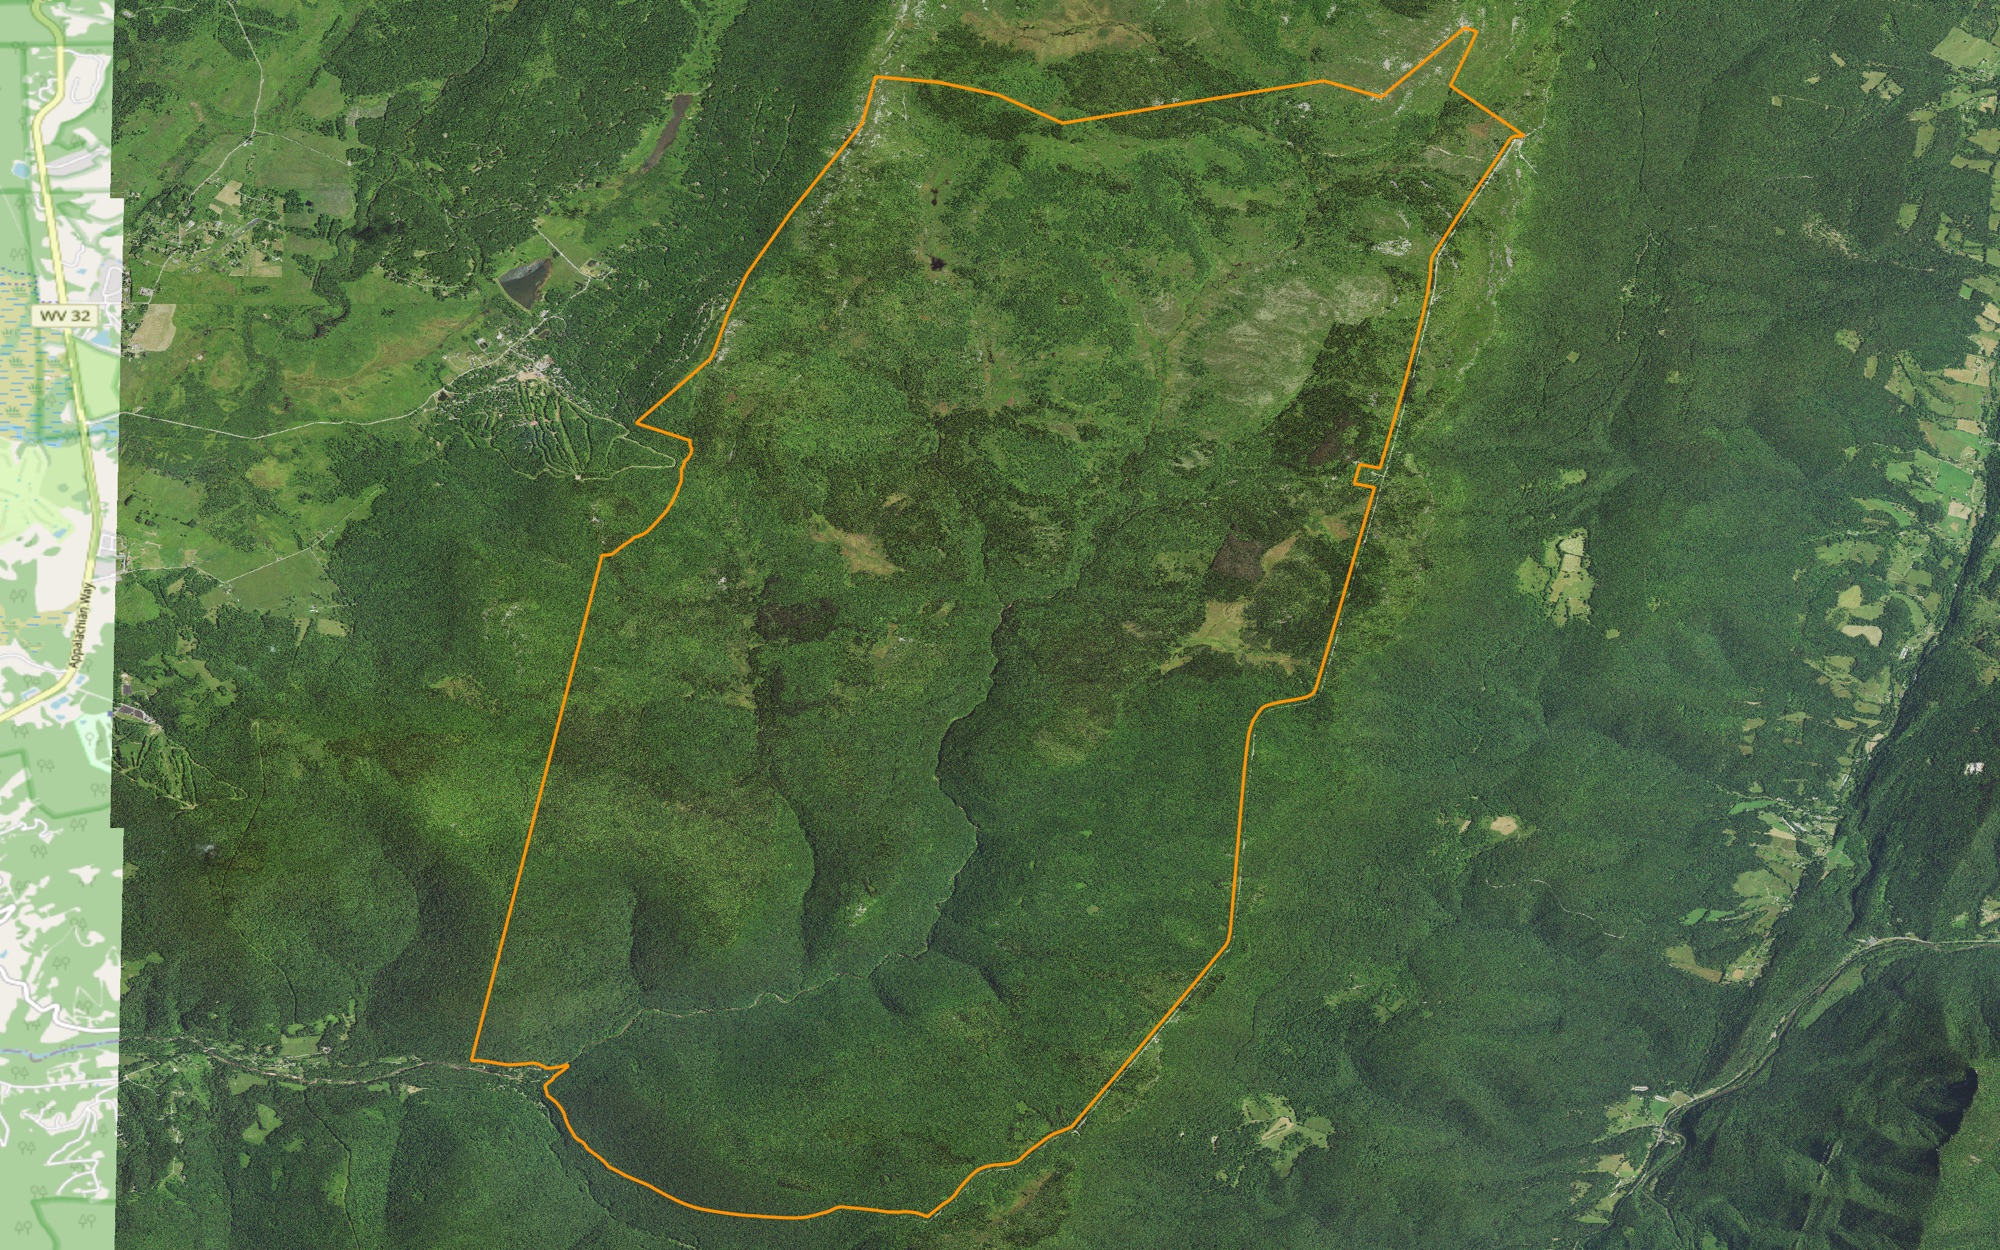
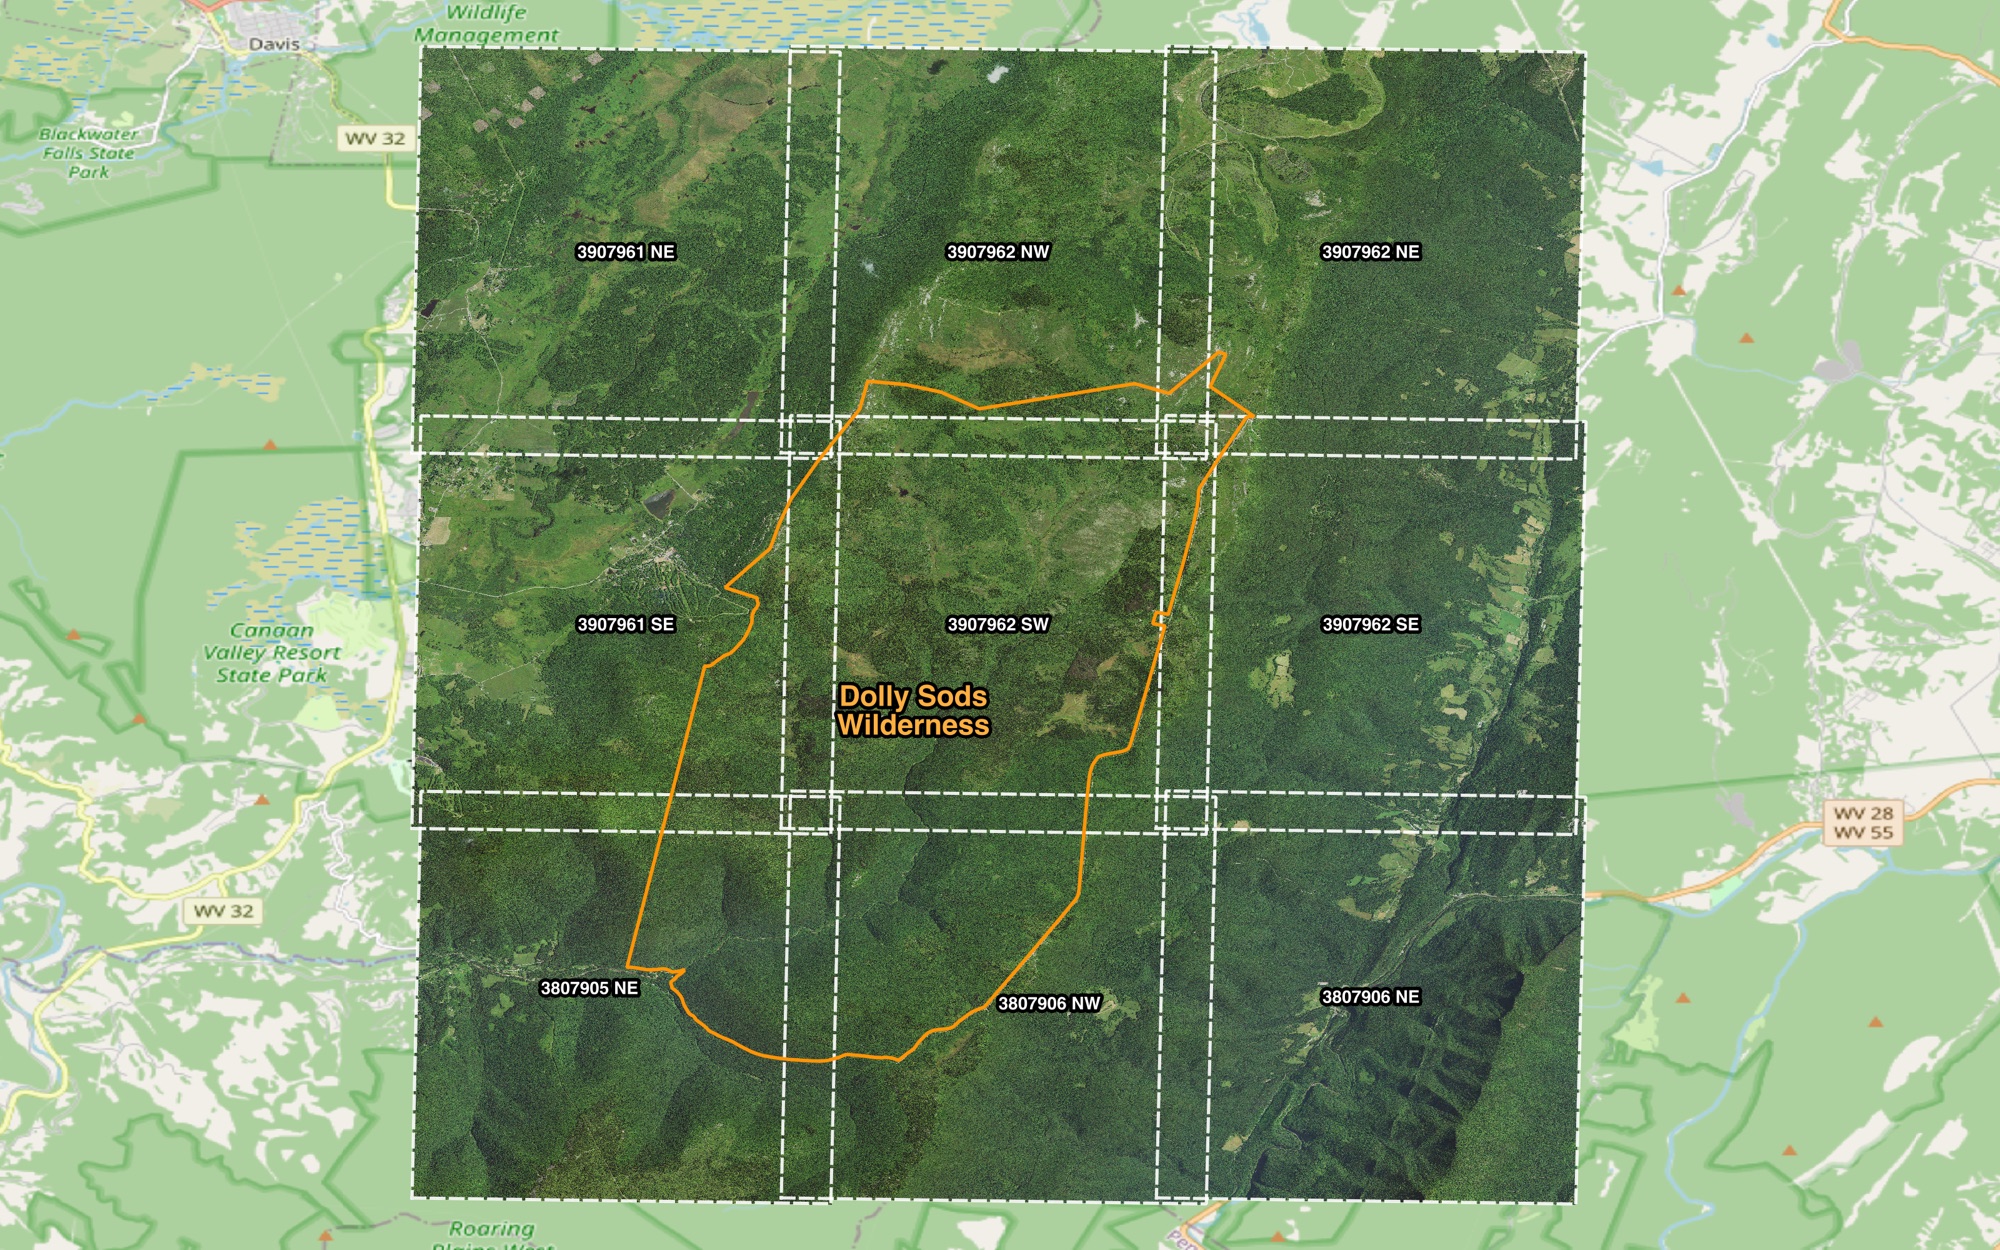
NAIP coverage: Dolly Sods Wilderness, West VirginiaThe 2020 NAIP imagery (60 cm) downloaded for the Dolly Sods Wilderness area of interest (orange), shown in QGIS. At the left edge the tiles end and the basemap shows through.Nine scenes, one area of interestThe 9 NAIP quarter-quad tiles the run found (dashed, labeled by tile ID) covering the Dolly Sods Wilderness area of interest (orange).
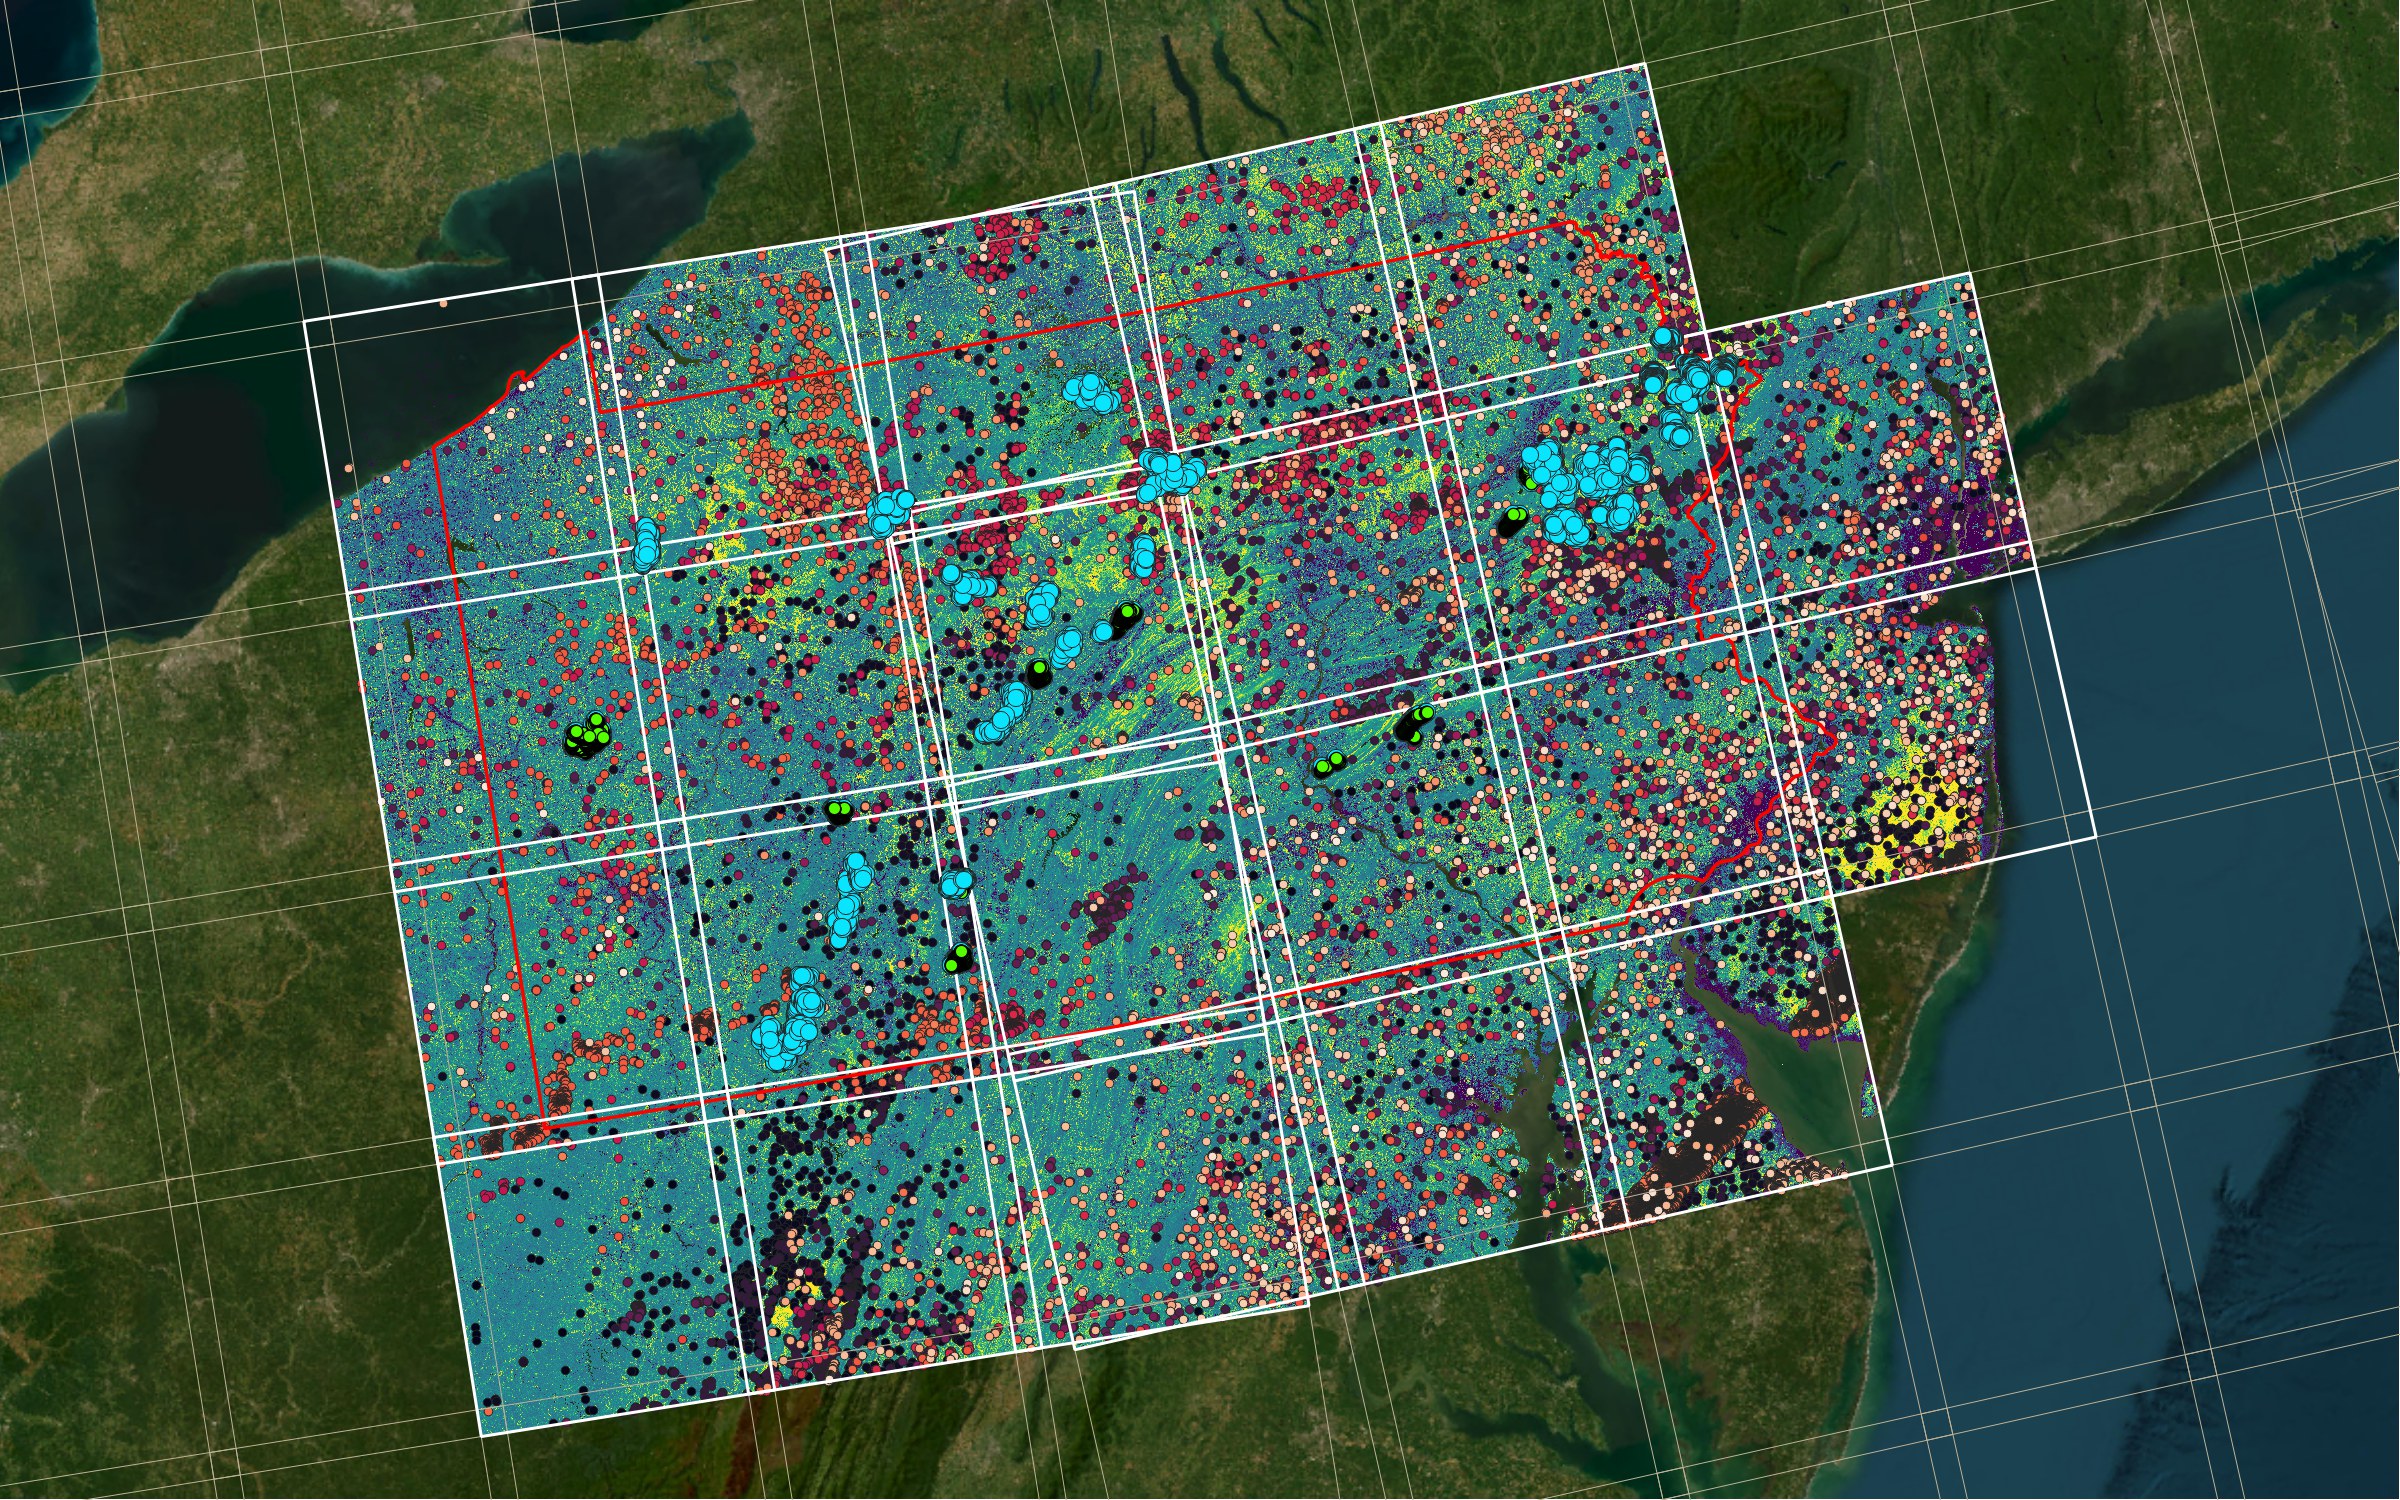
Pennsylvania study area: leaf-off NDVI, survey sites and outliersLeaf-off NDVI from NASA HLS (2015–2021), HLS tiles, vegetation survey sites and NDVI outliers colored by date. Imagery: Esri World Imagery.
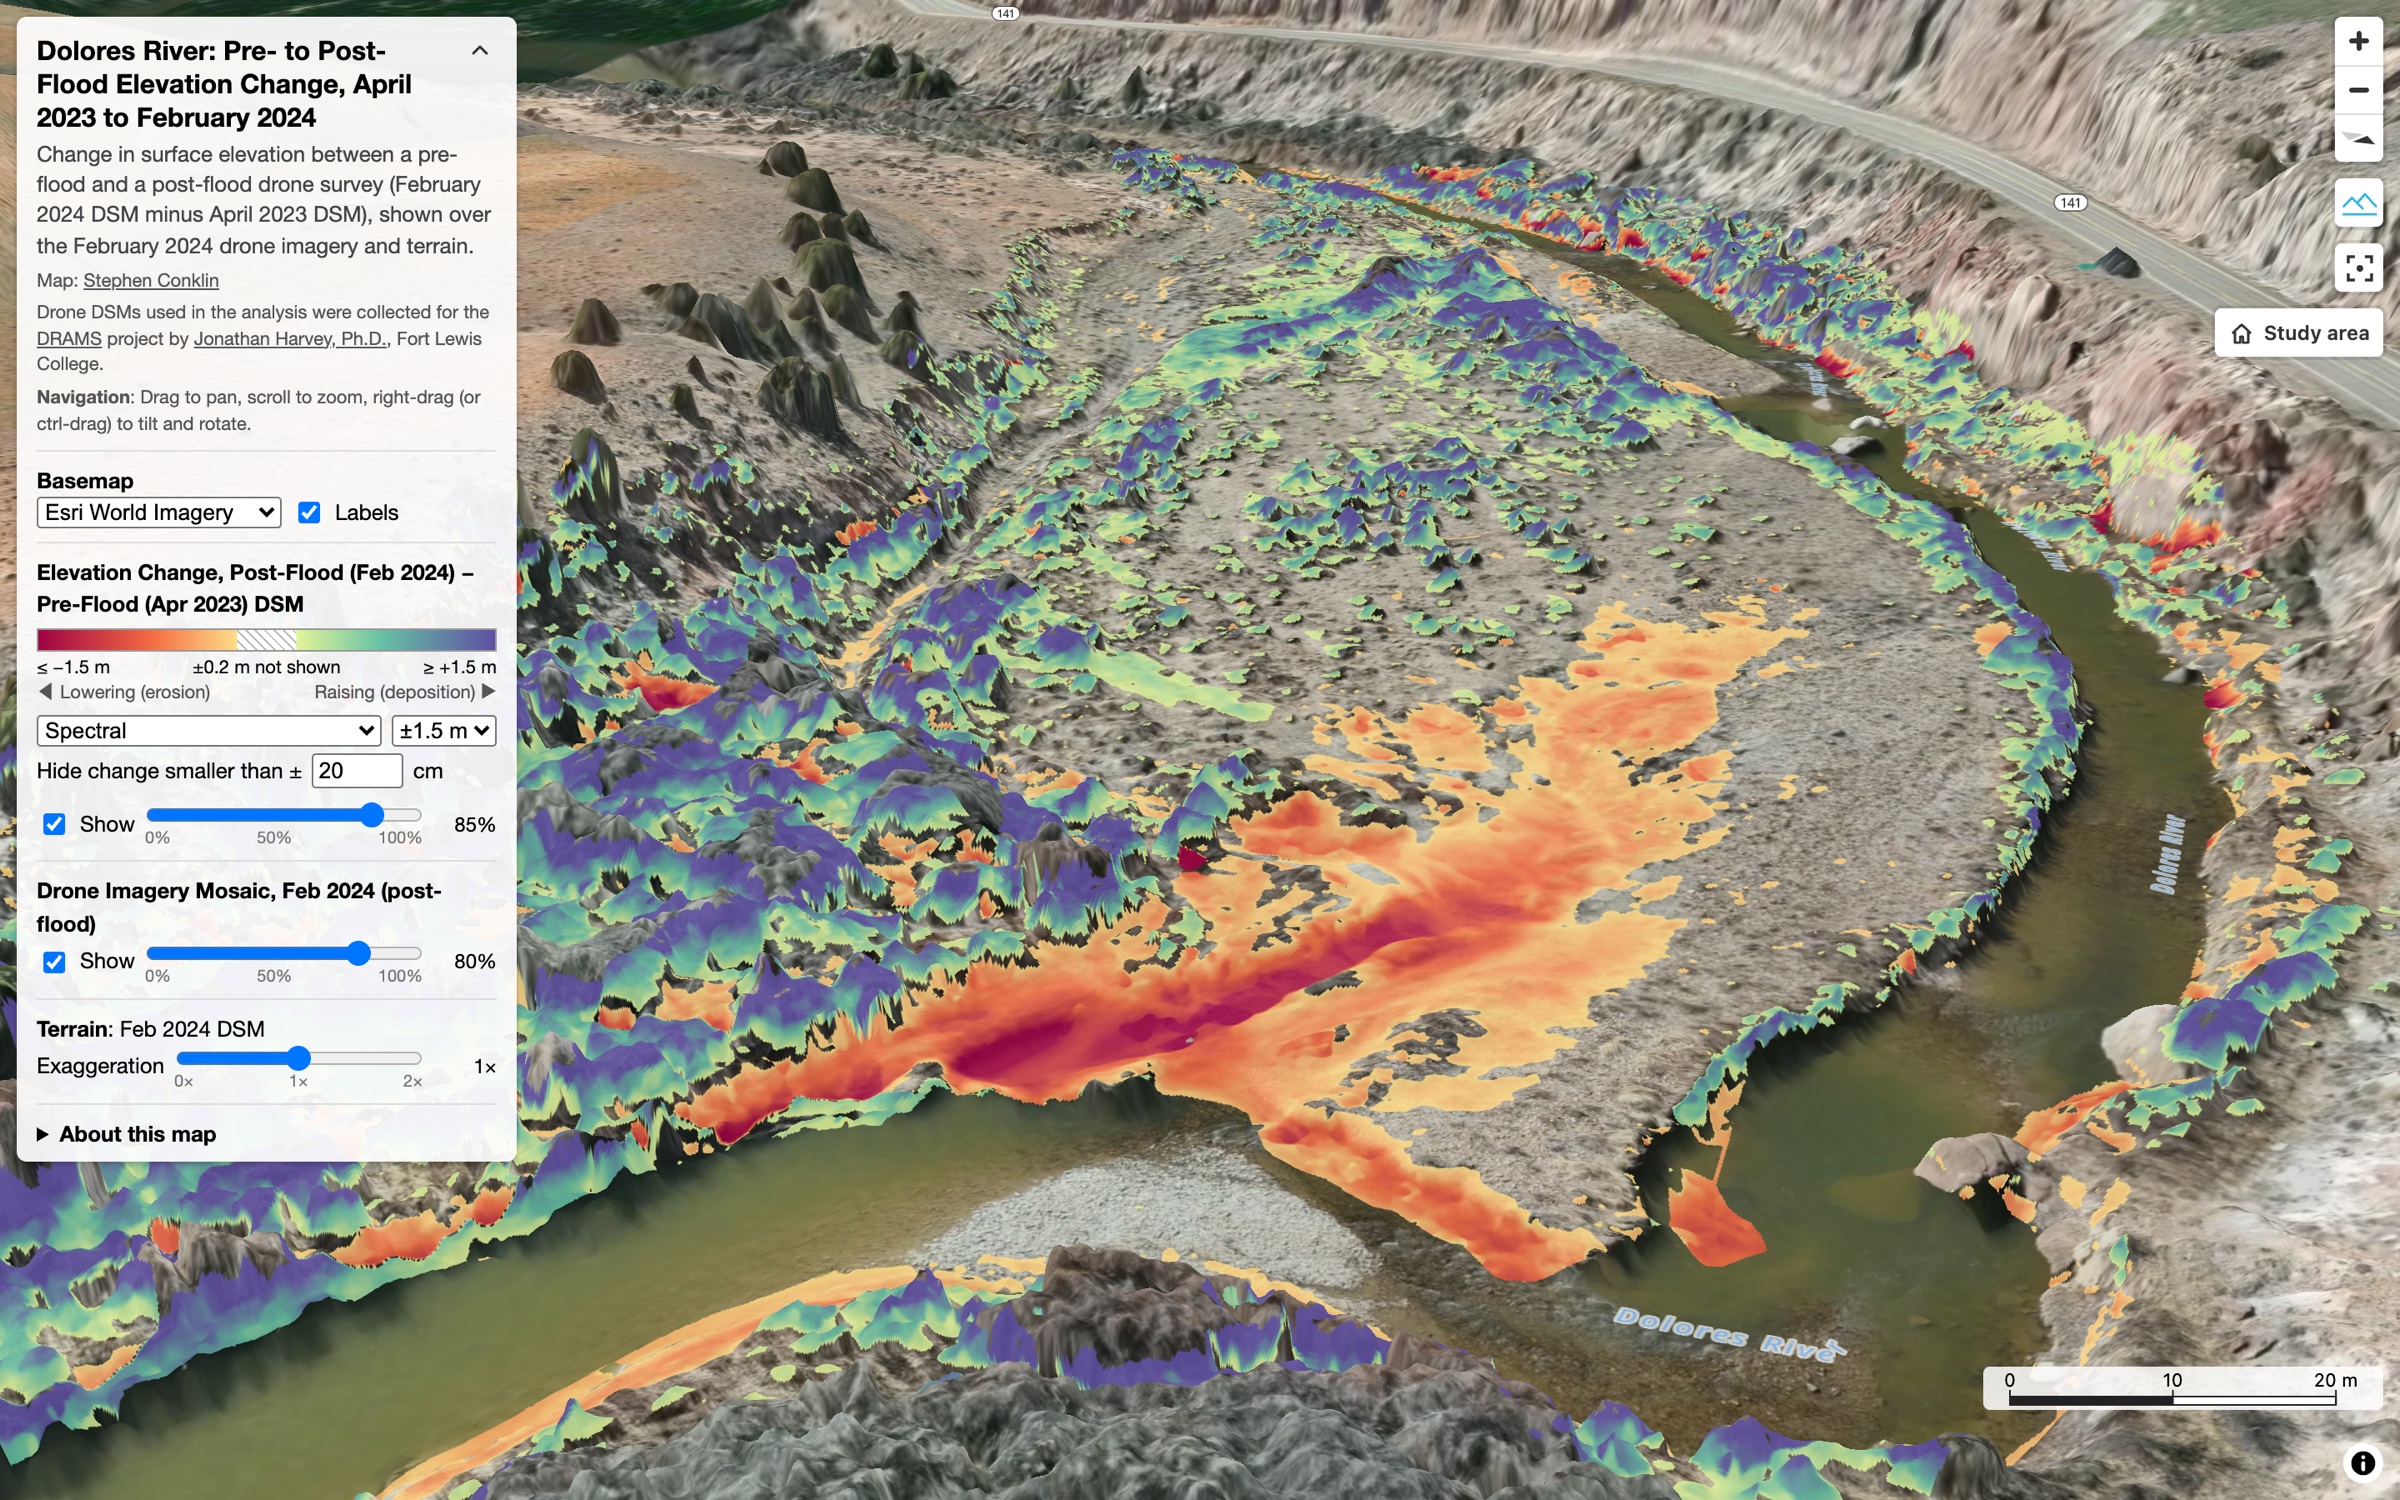
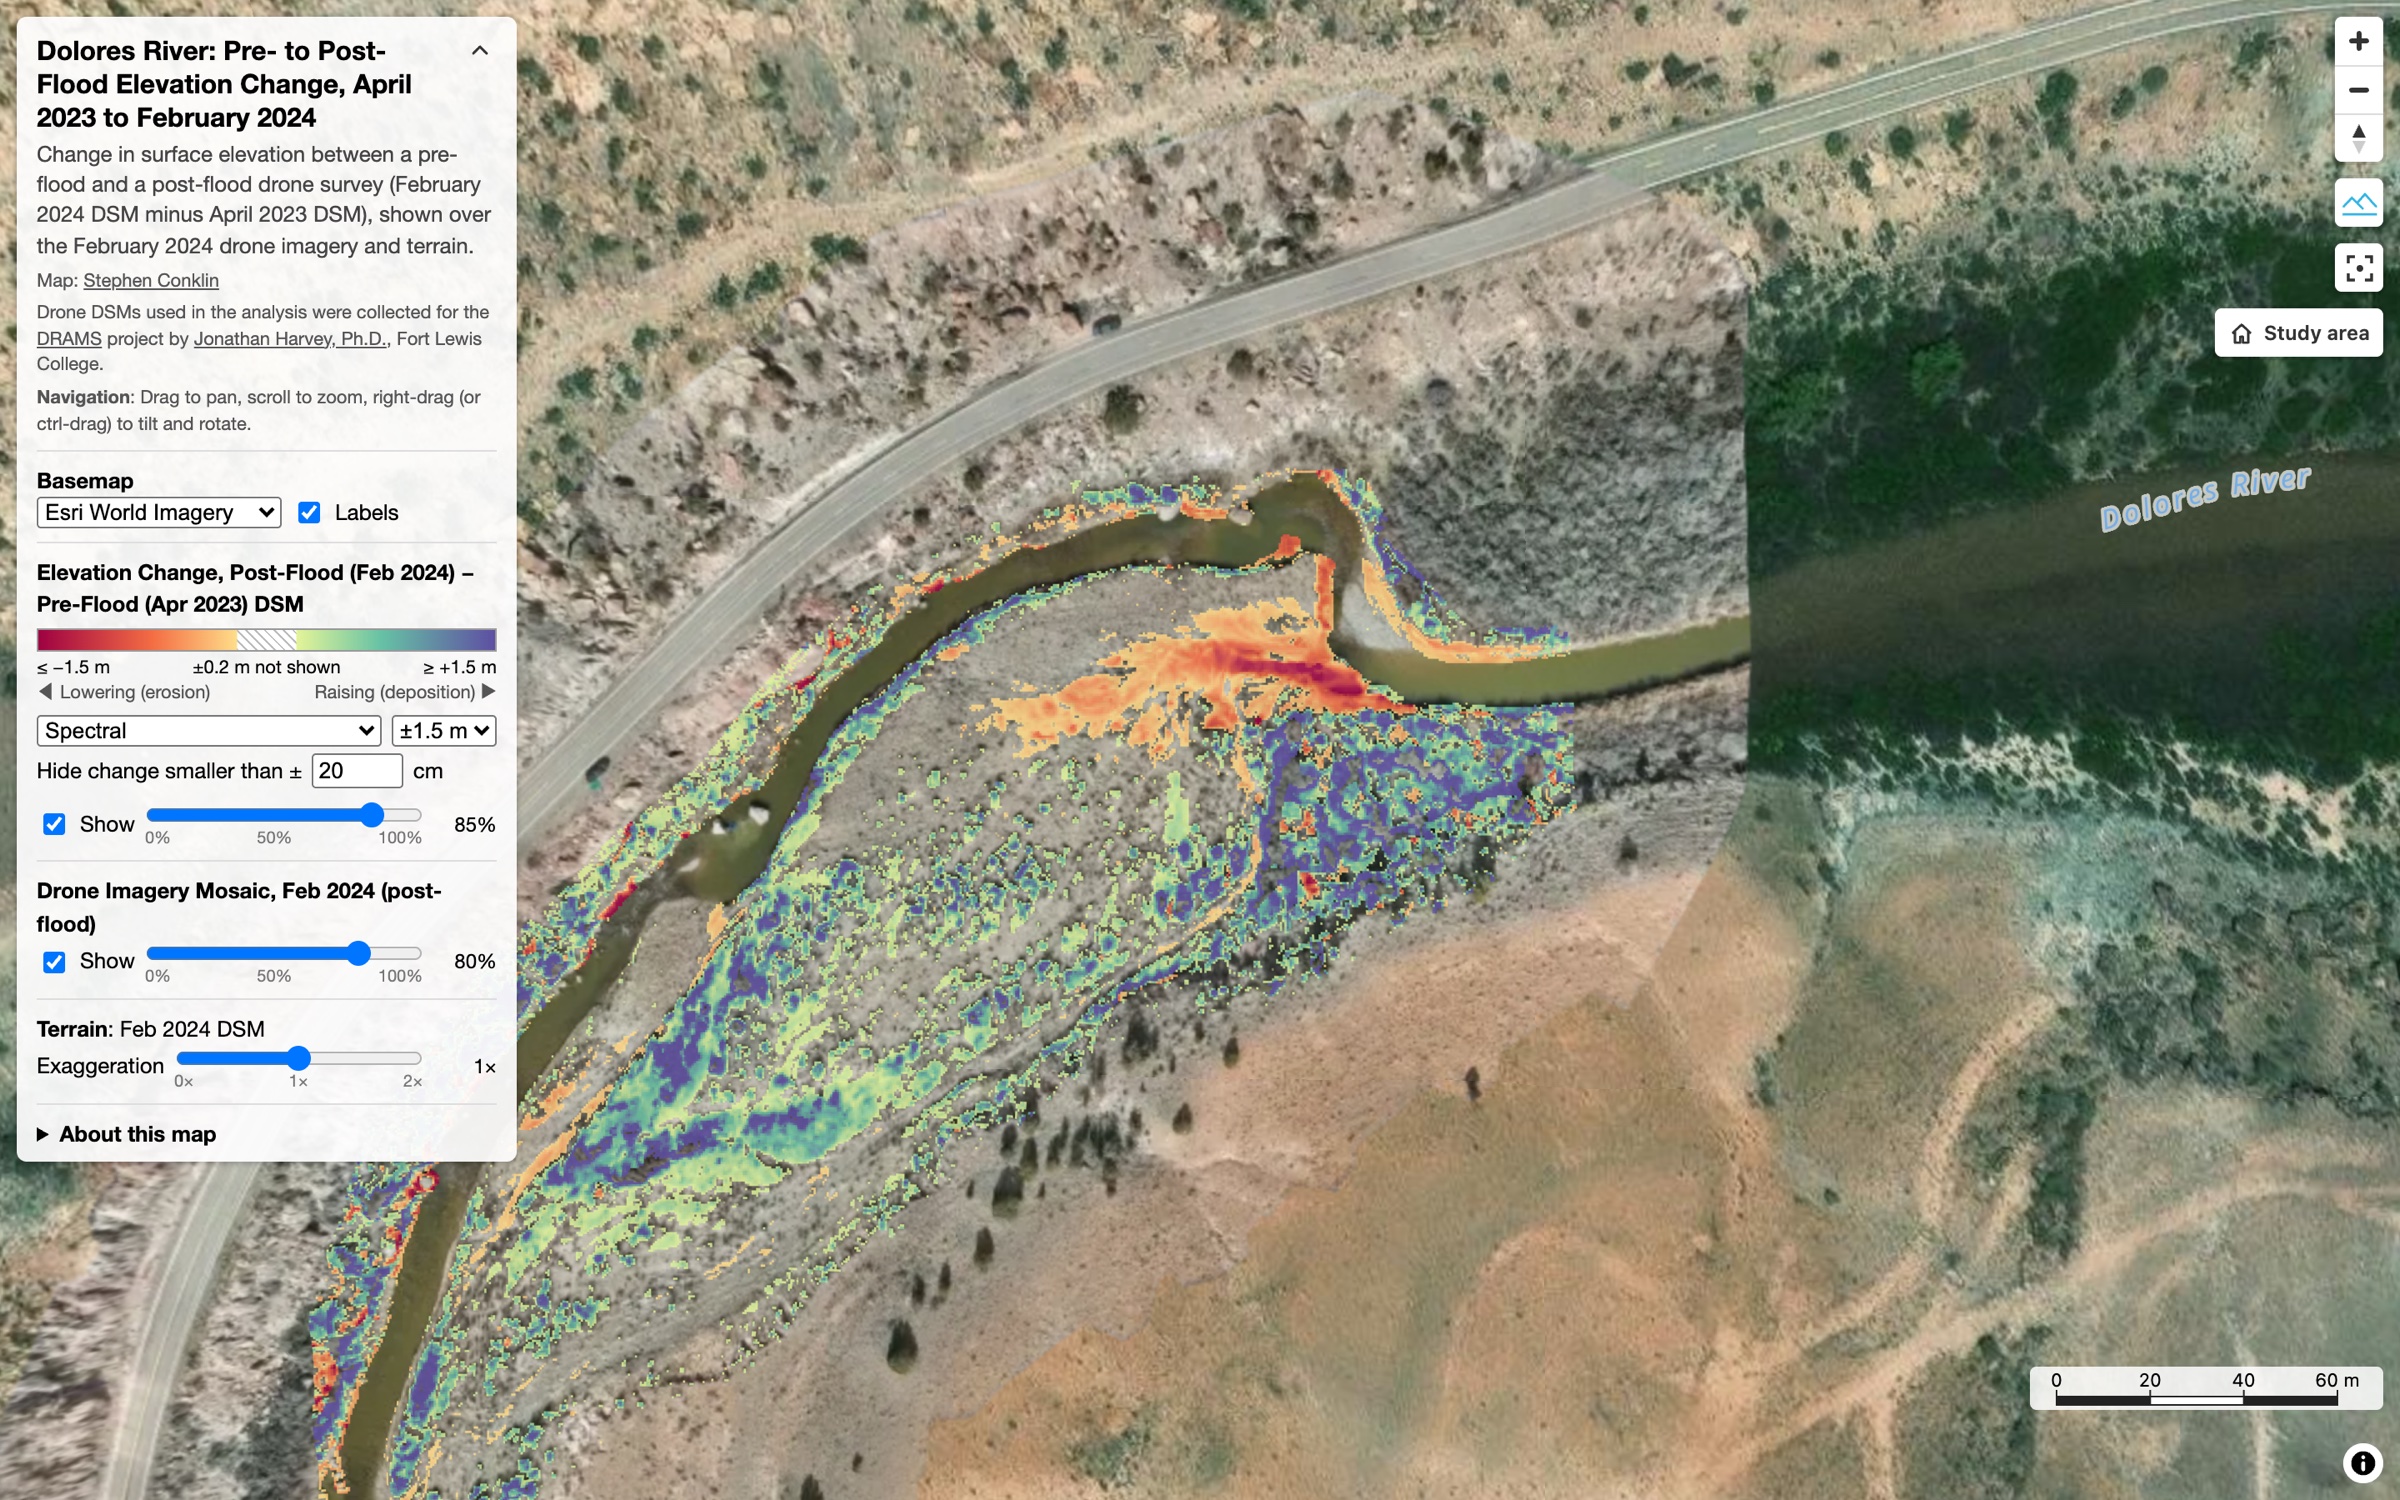
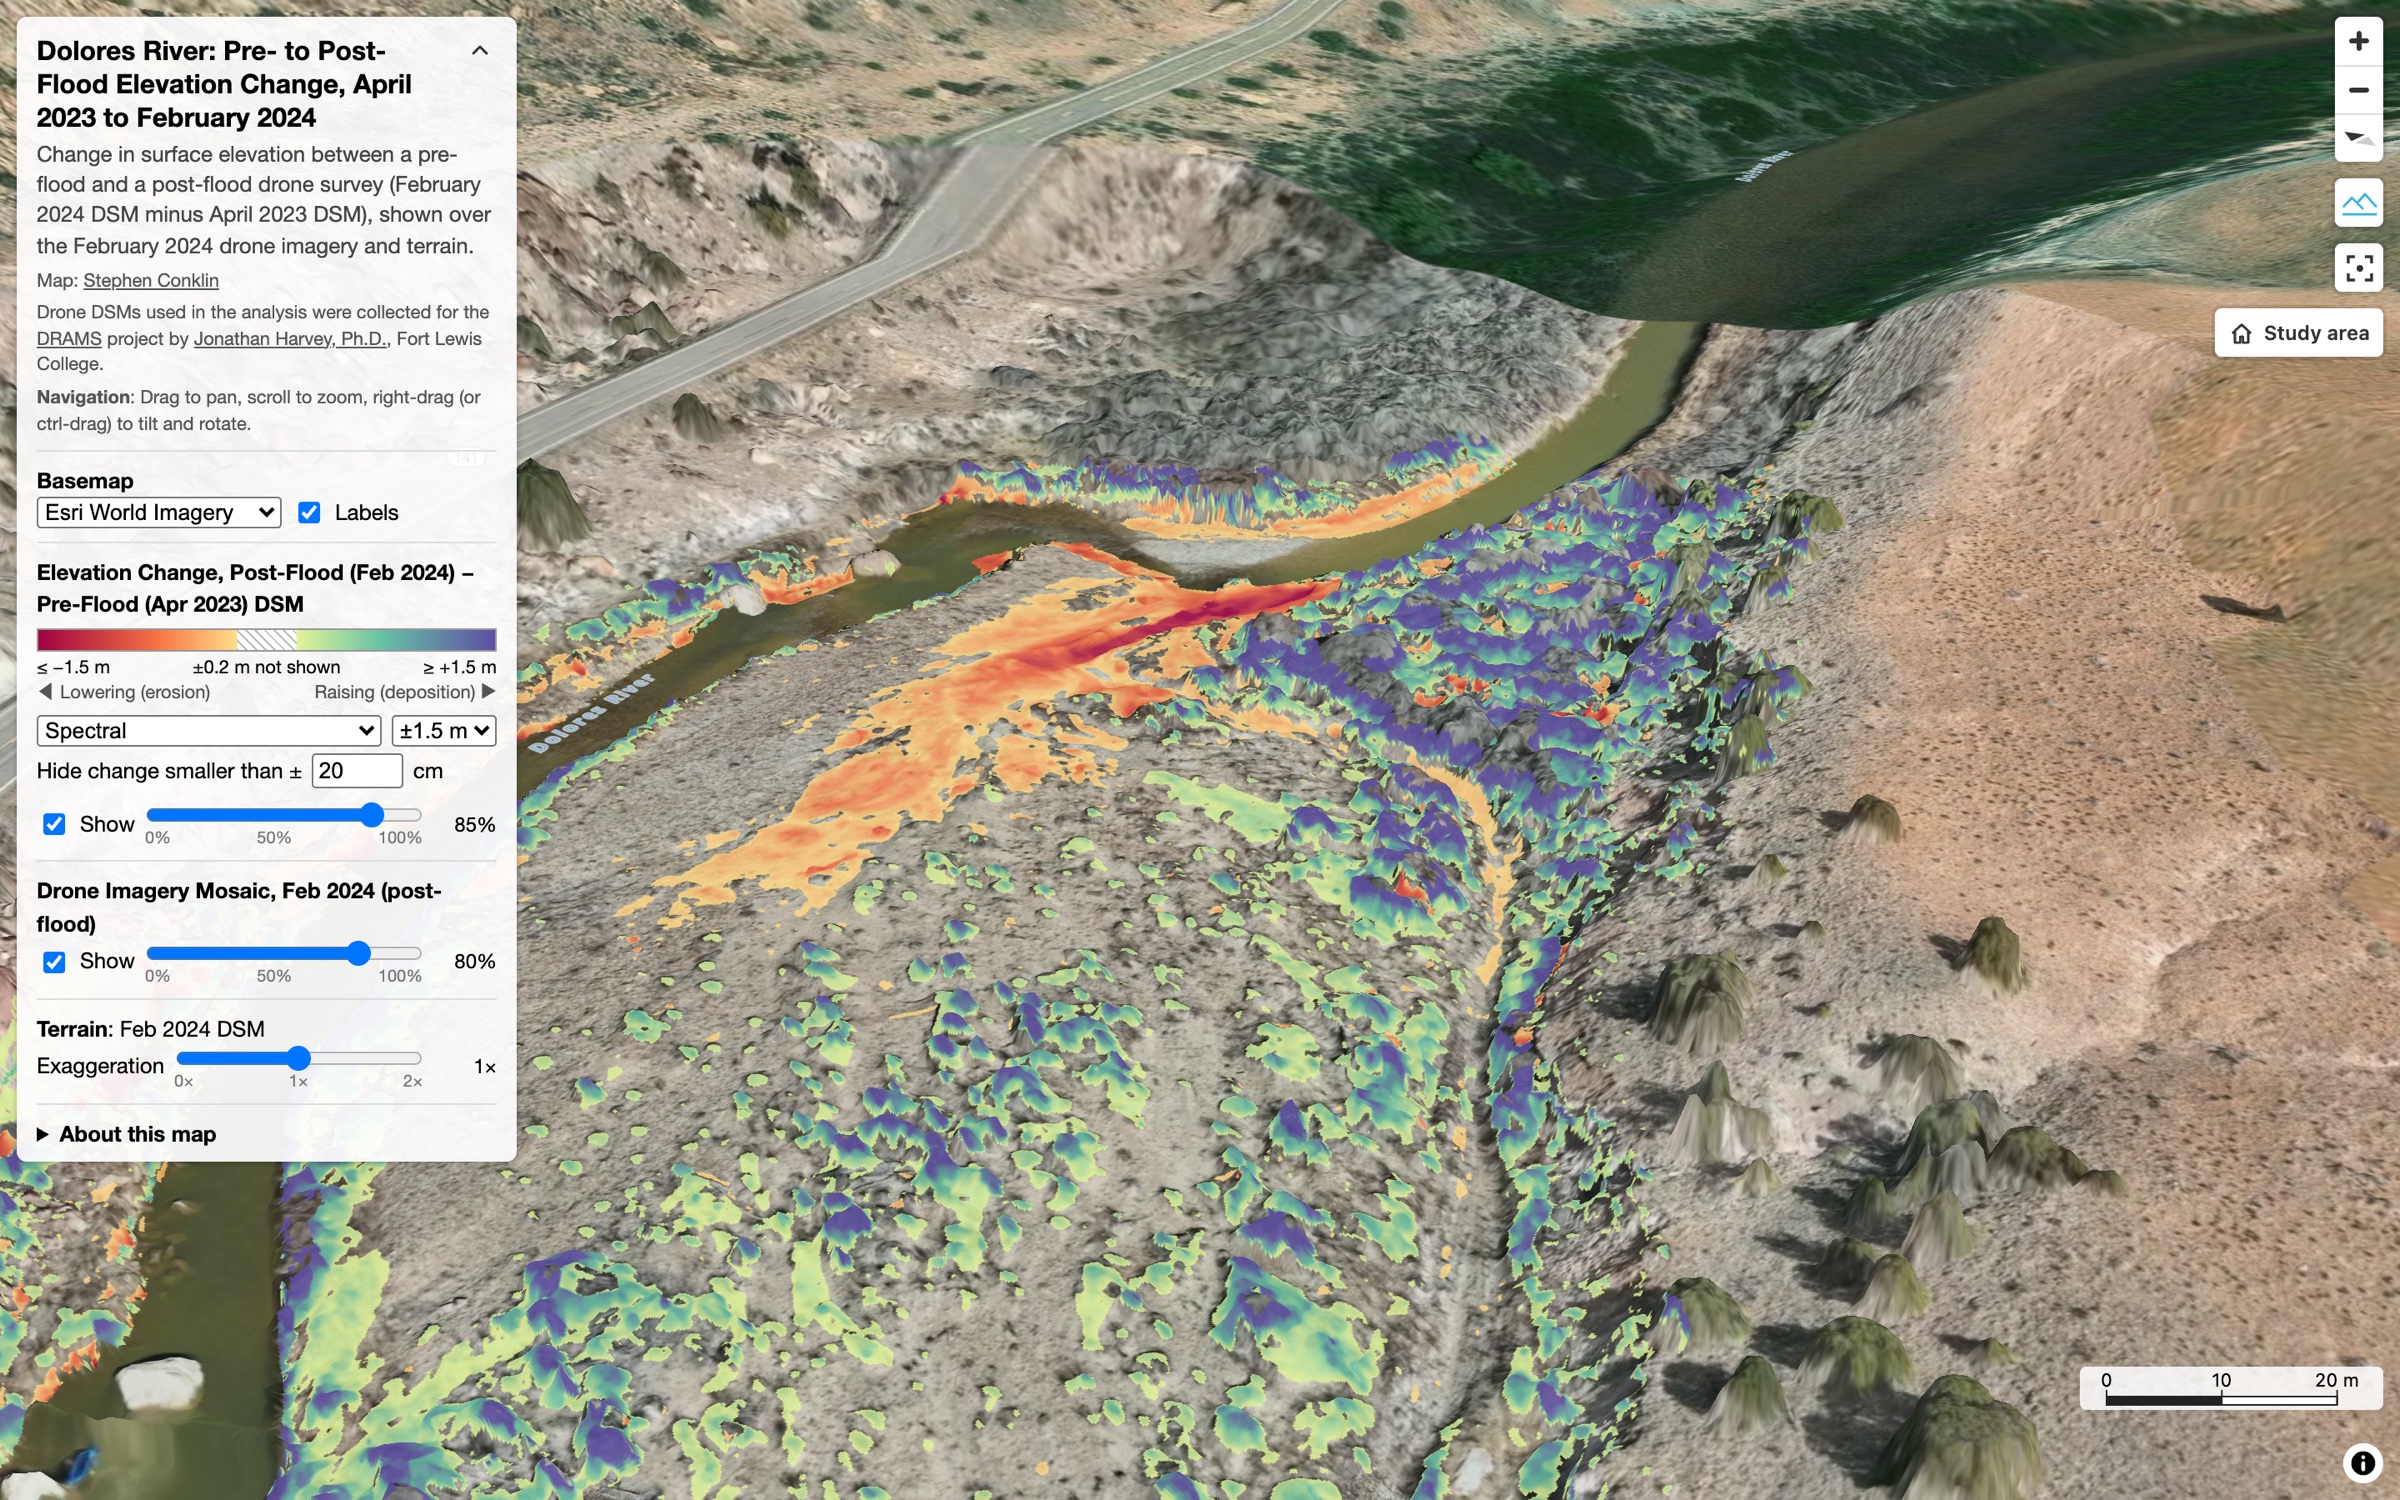
3D view of the survey reachElevation change draped on the February 2024 drone orthomosaic and DSM. Red is erosion, blue is deposition.DSM of difference, February 2024 − April 2023Top-down view of the whole reach. ±0.2 m level of detection, ±1.5 m stretch.Looking across the bendThe scoured channel and new deposits from the opposite side, with 3D terrain.
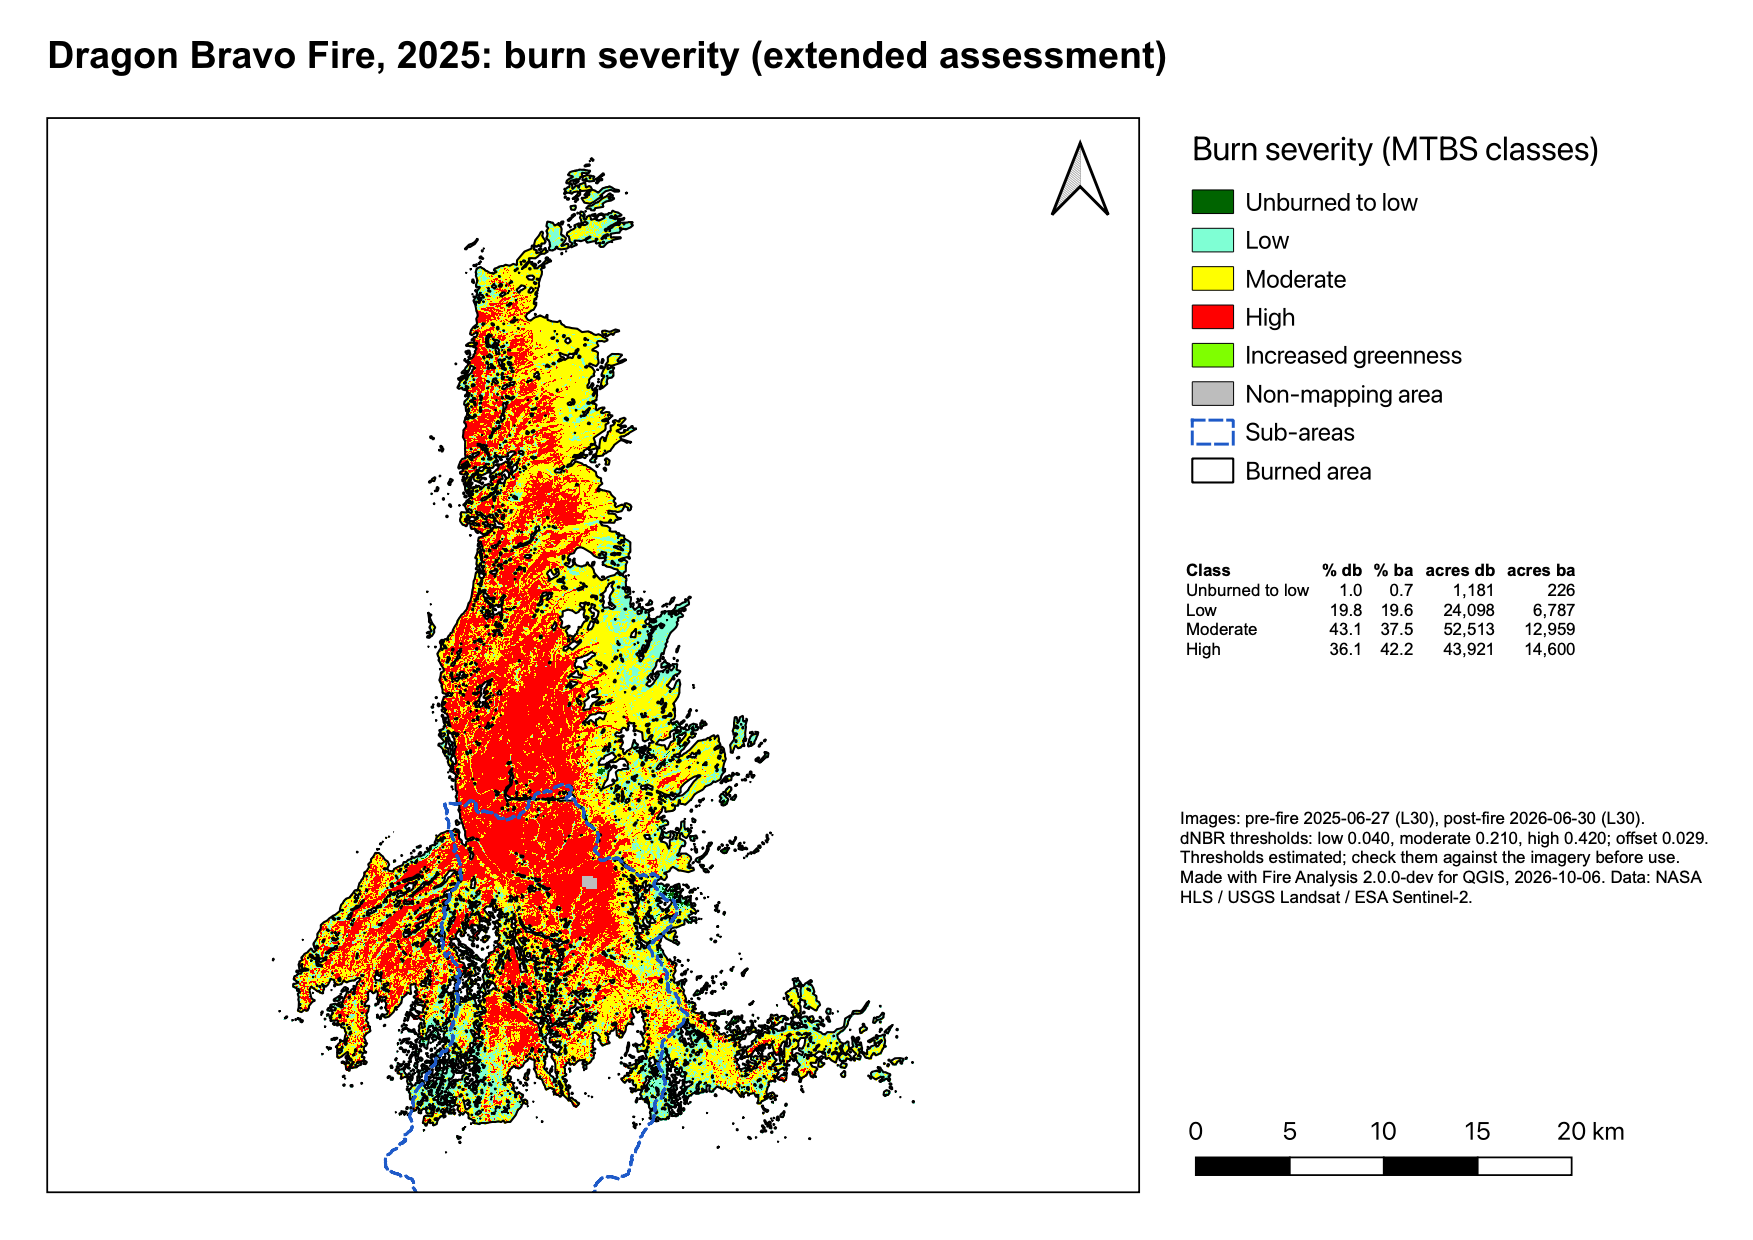
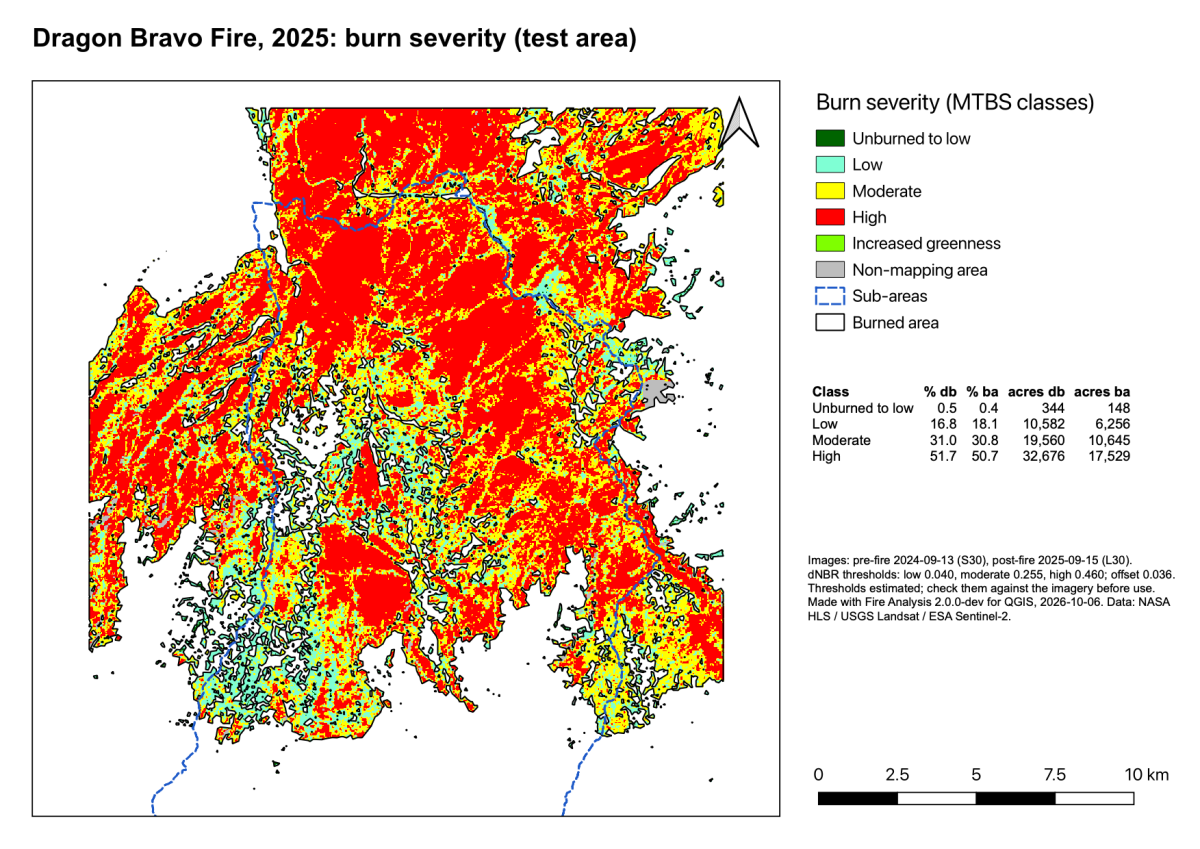
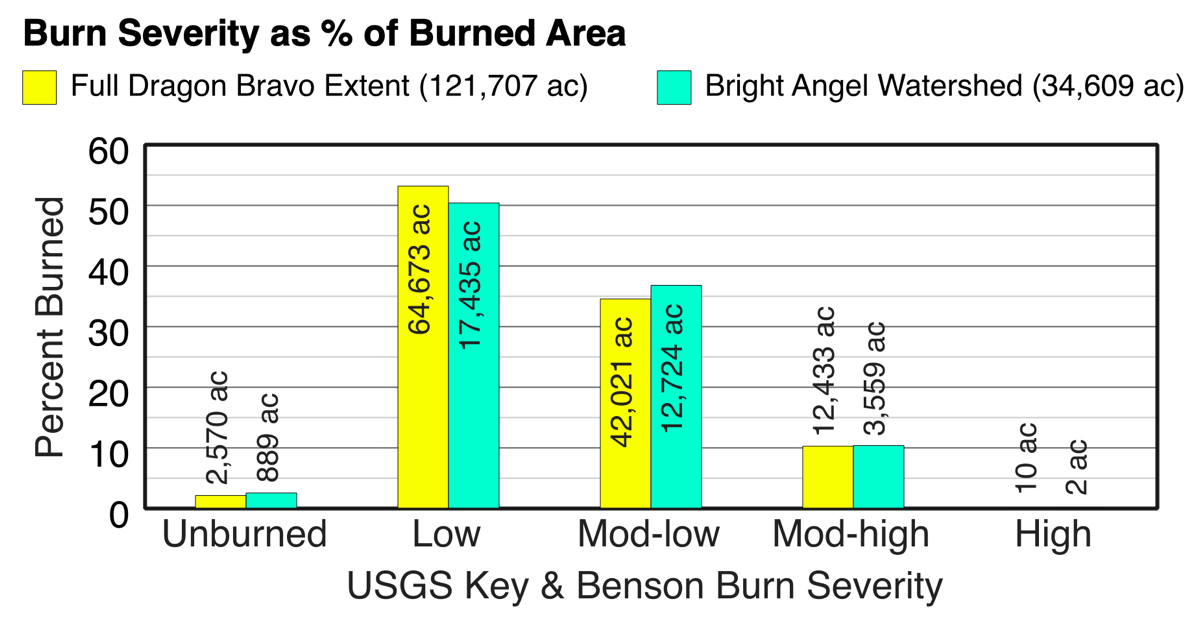
Dragon Bravo Fire, 2025: extended assessmentNext-growing-season image pair.Dragon Bravo test area with Bright Angel watershedHLS imagery, thresholds estimated from nearby MTBS fires.Burn severity by zonePercent of burned area per class, fire vs. watershed.