Dolores River Geomorphic Change Detection
An interactive 3D web map of drone-measured erosion and deposition after a dam-release flood in Southwest Colorado.
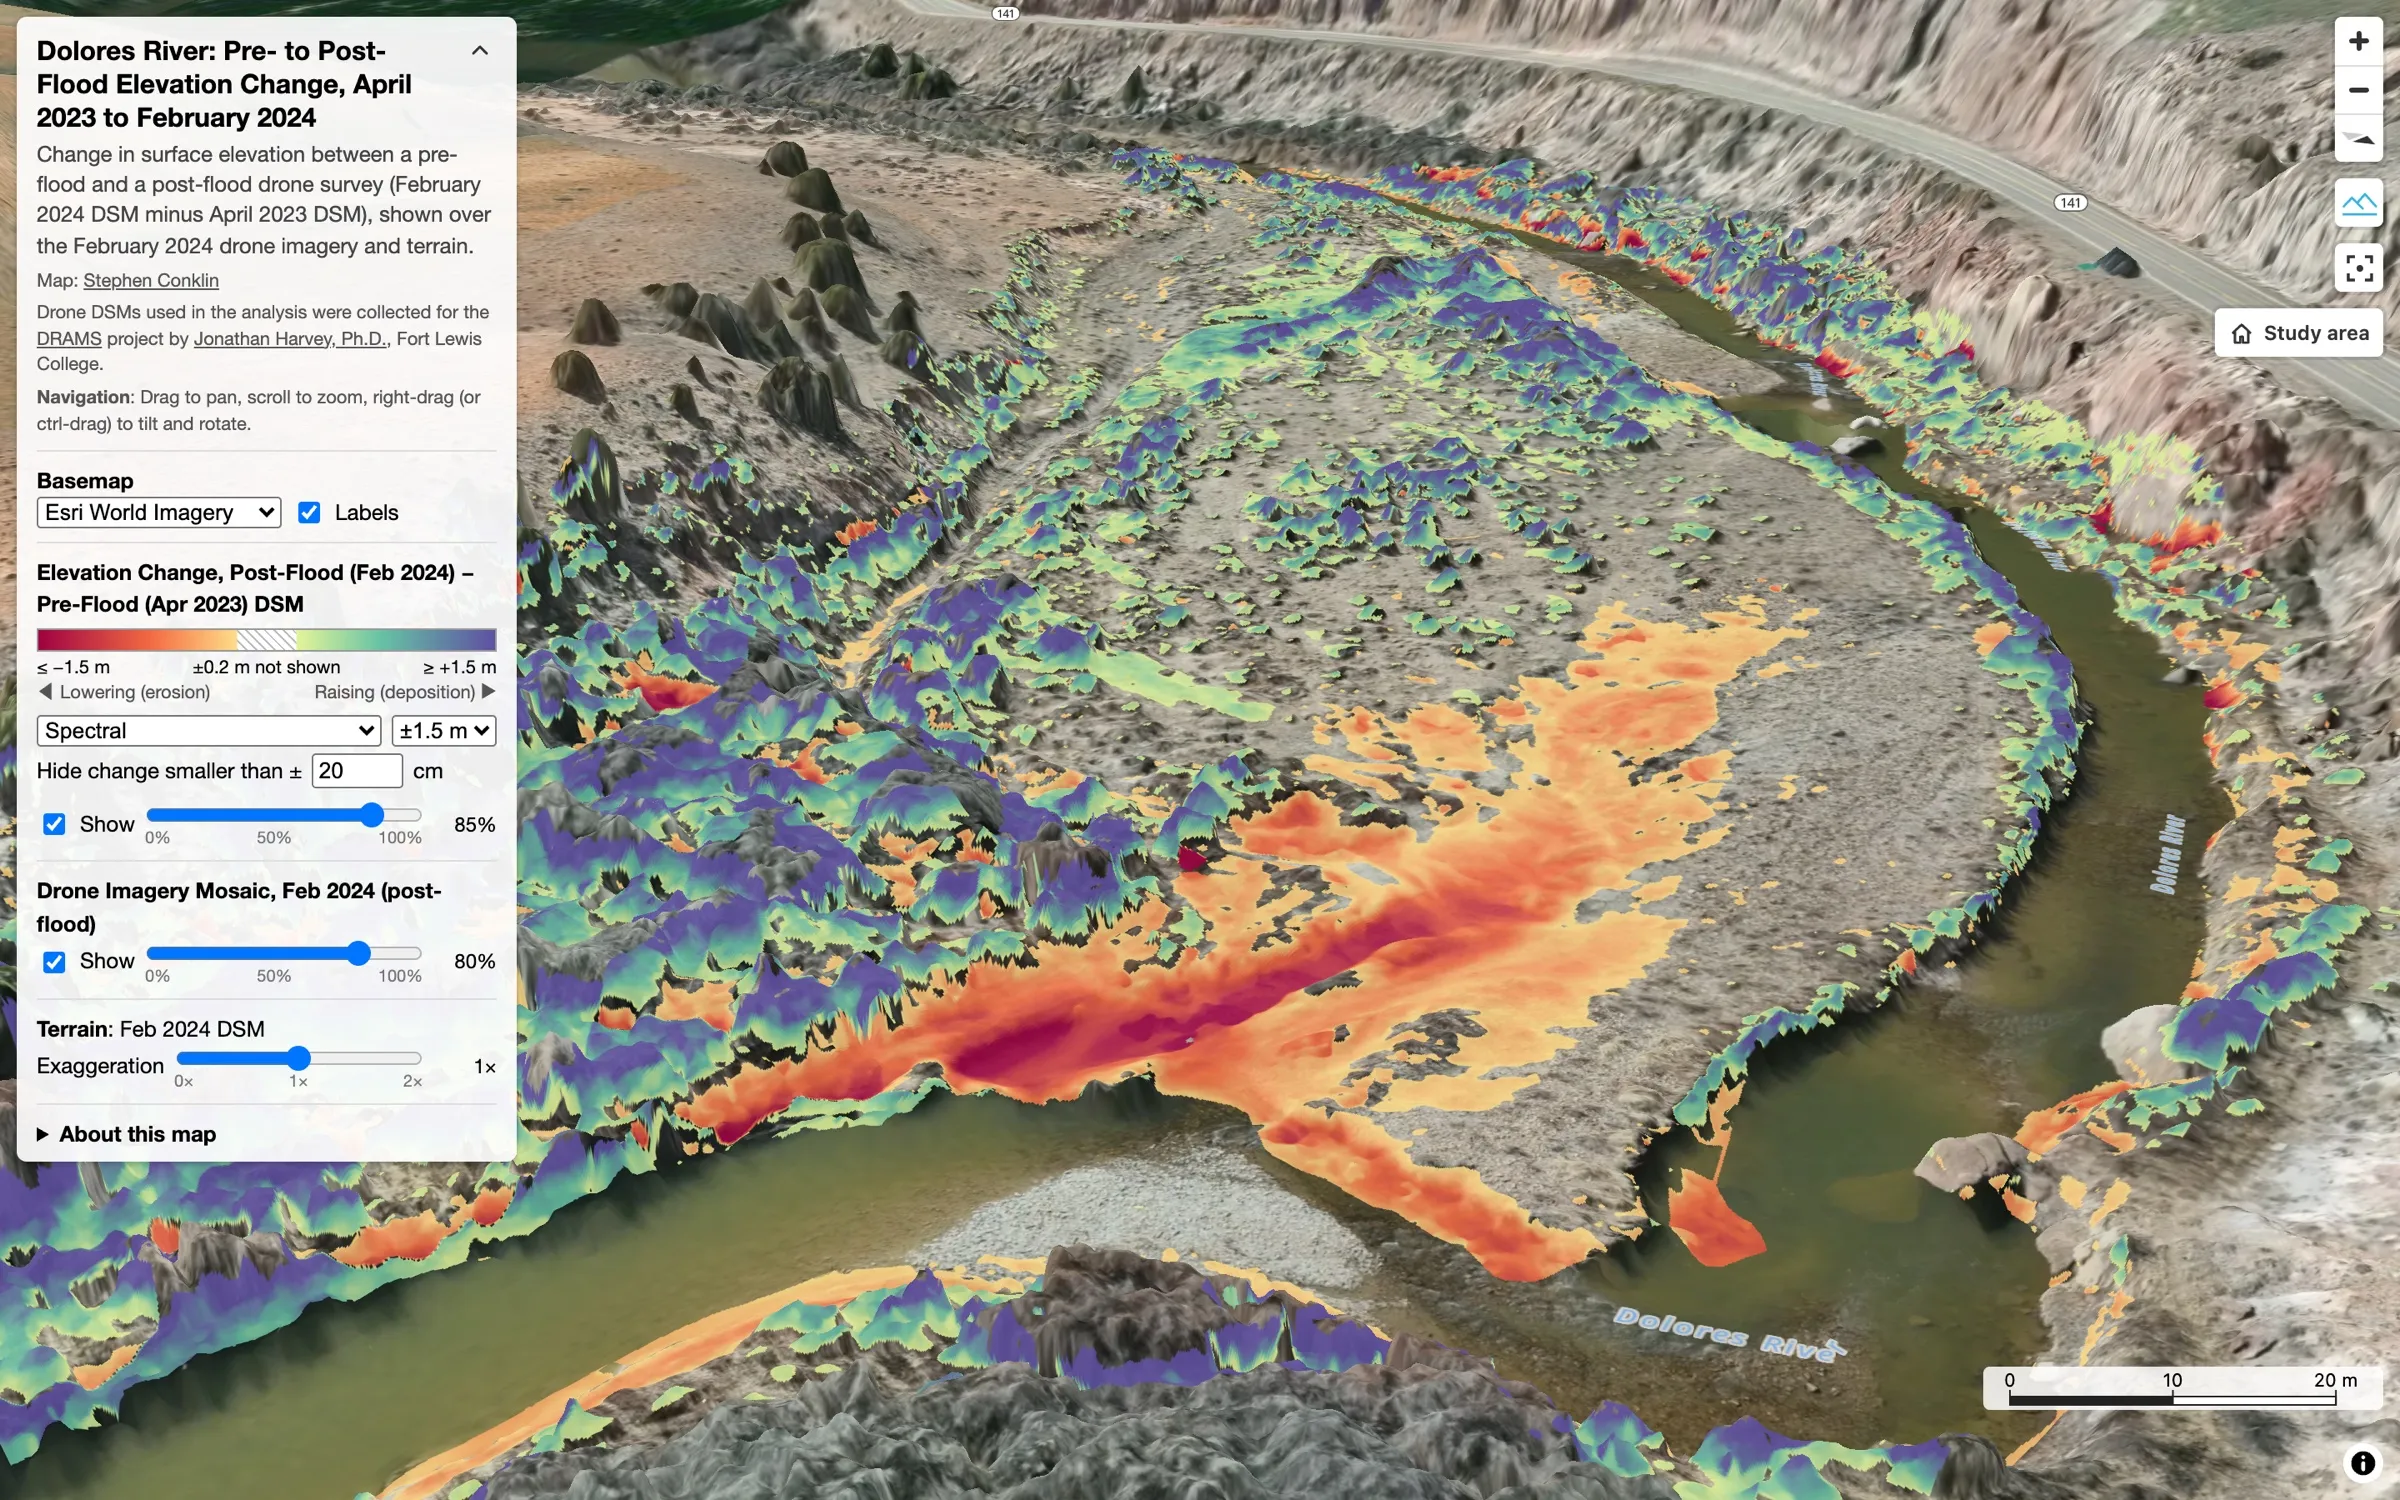
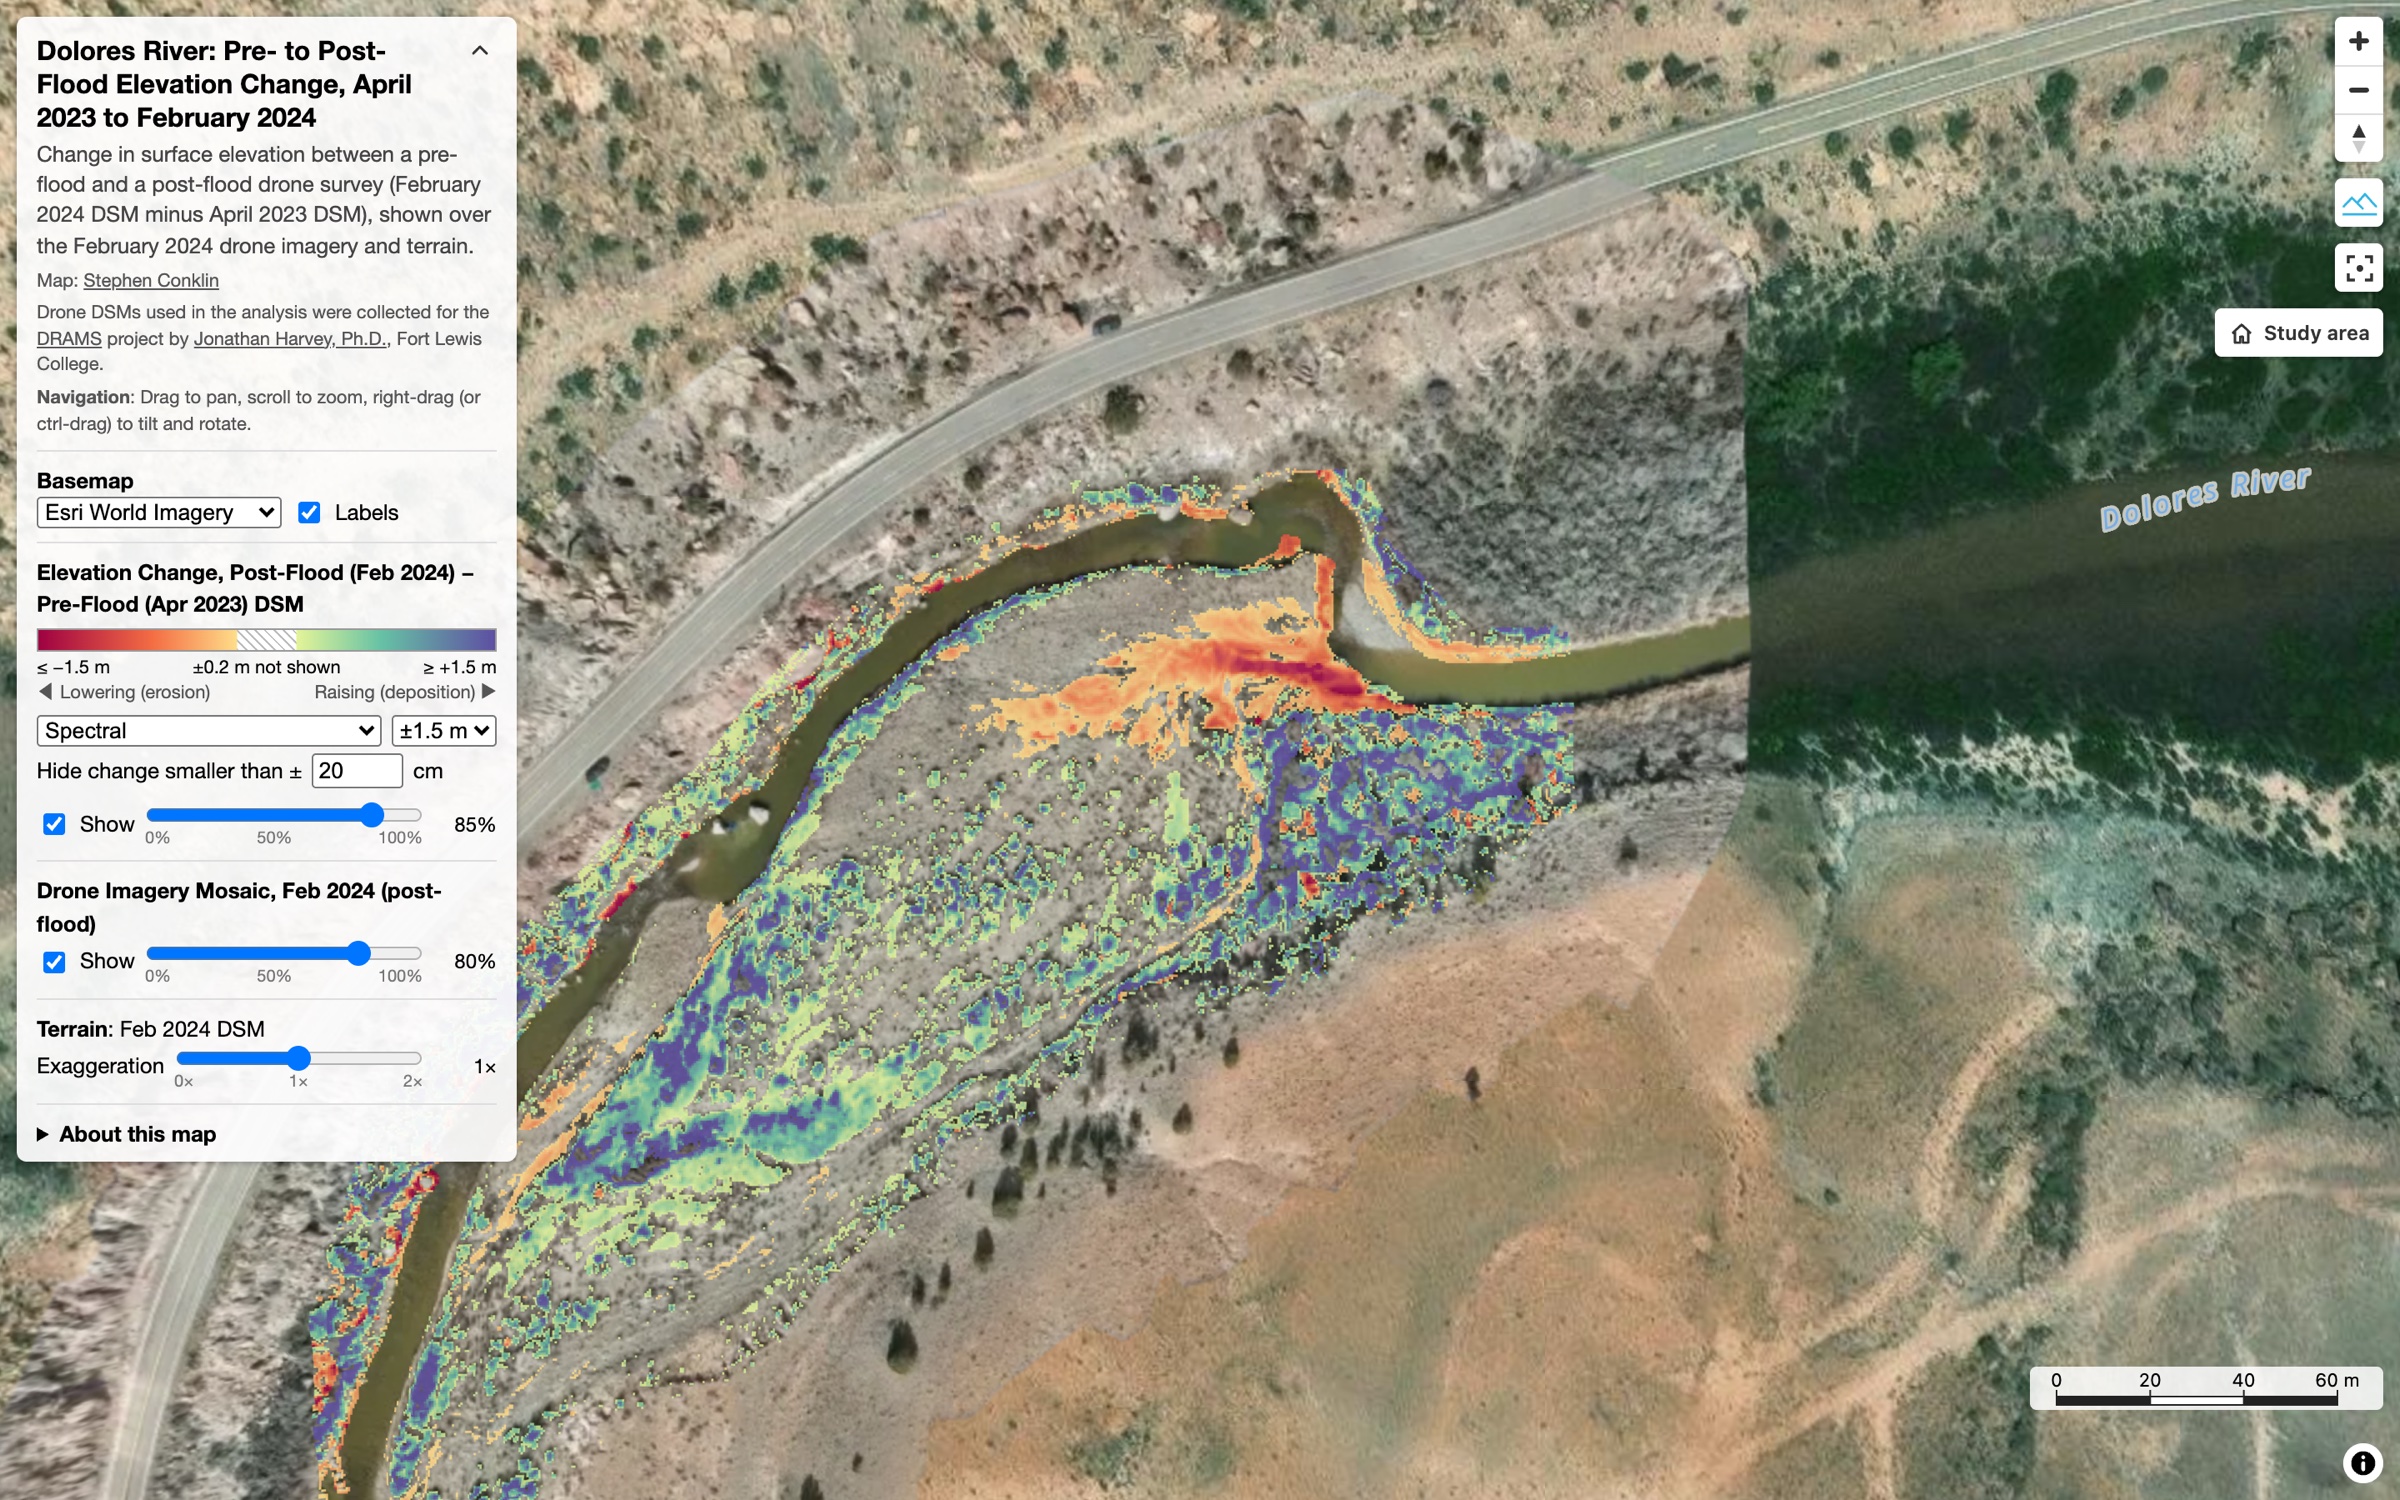
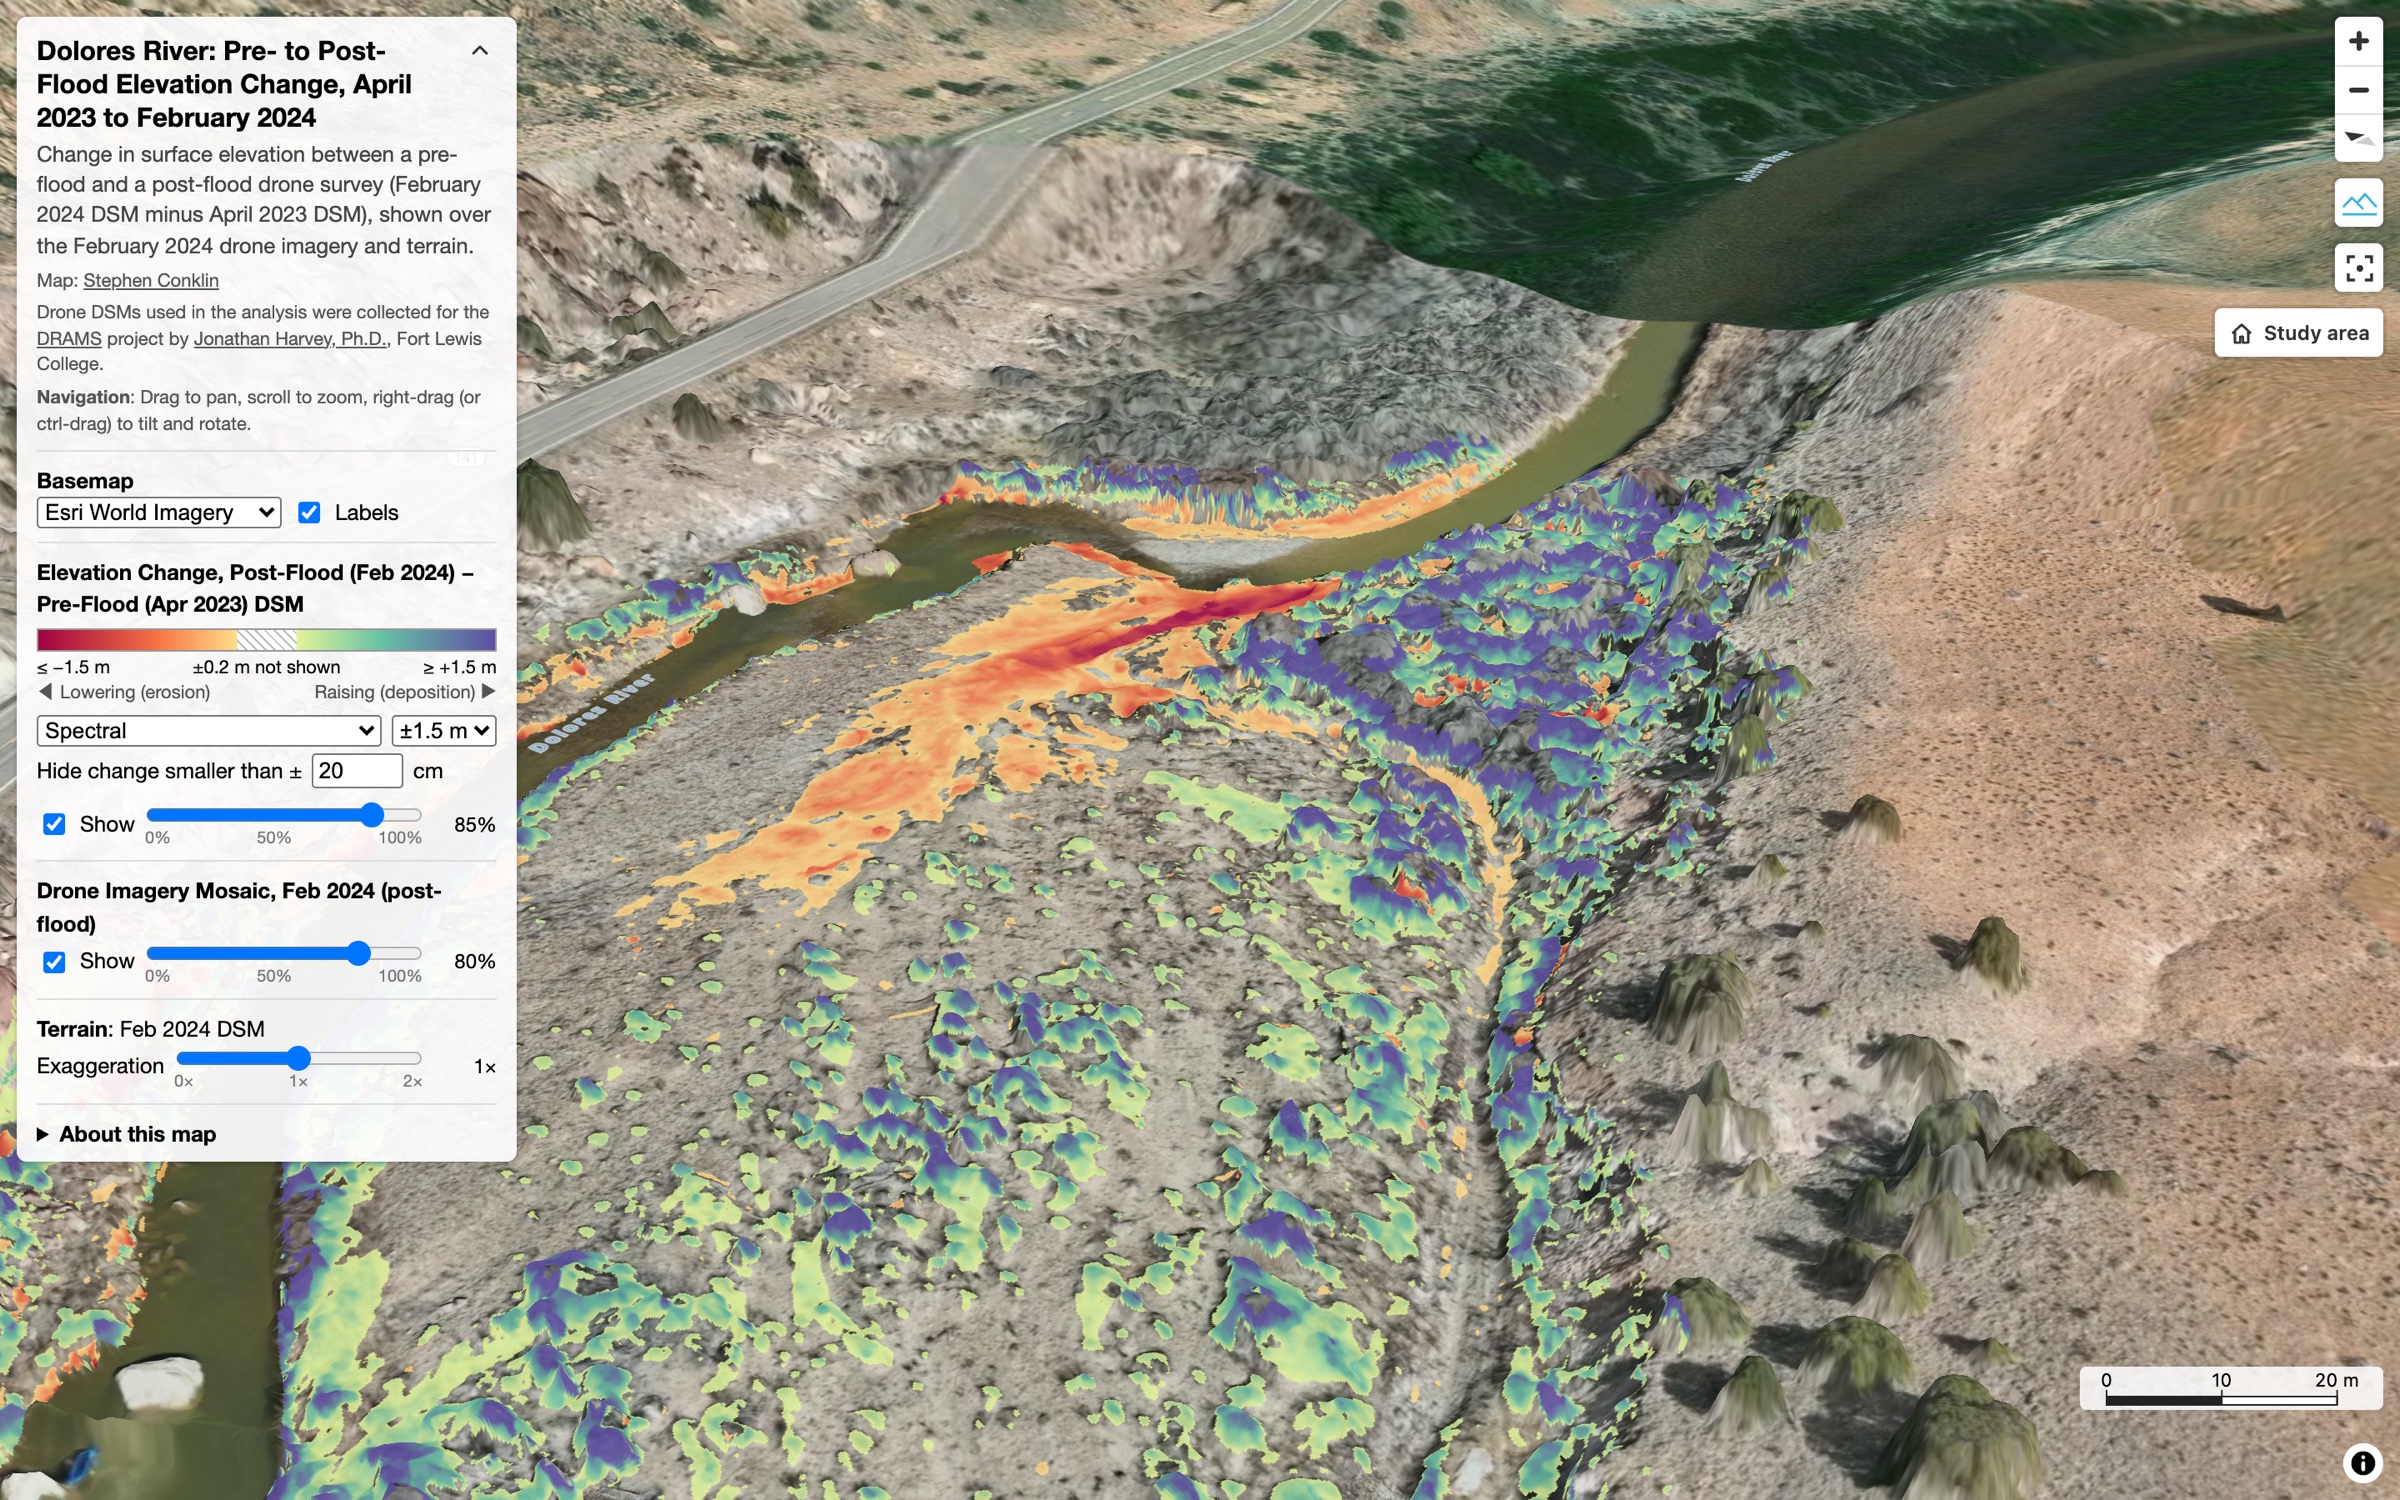
In spring 2023, a heavy winter snowpack forced a large flood release from McPhee Dam down the Dolores River. Drone surveys flown before (April 2023) and after (February 2024) the release capture the reshaping of the channel at centimeter resolution. This map lets anyone explore that change in 3D.
What you can do
- Toggle the elevation-change layer: the post-flood DSM minus the pre-flood DSM, with a selectable color ramp and stretch and an adjustable minimum level of detection.
- Fly over the reach in 3D, with the February 2024 drone orthomosaic draped over the drone DSM.
- Switch basemaps between Esri World Imagery and OpenFreeMap.
Seeing real change, not noise
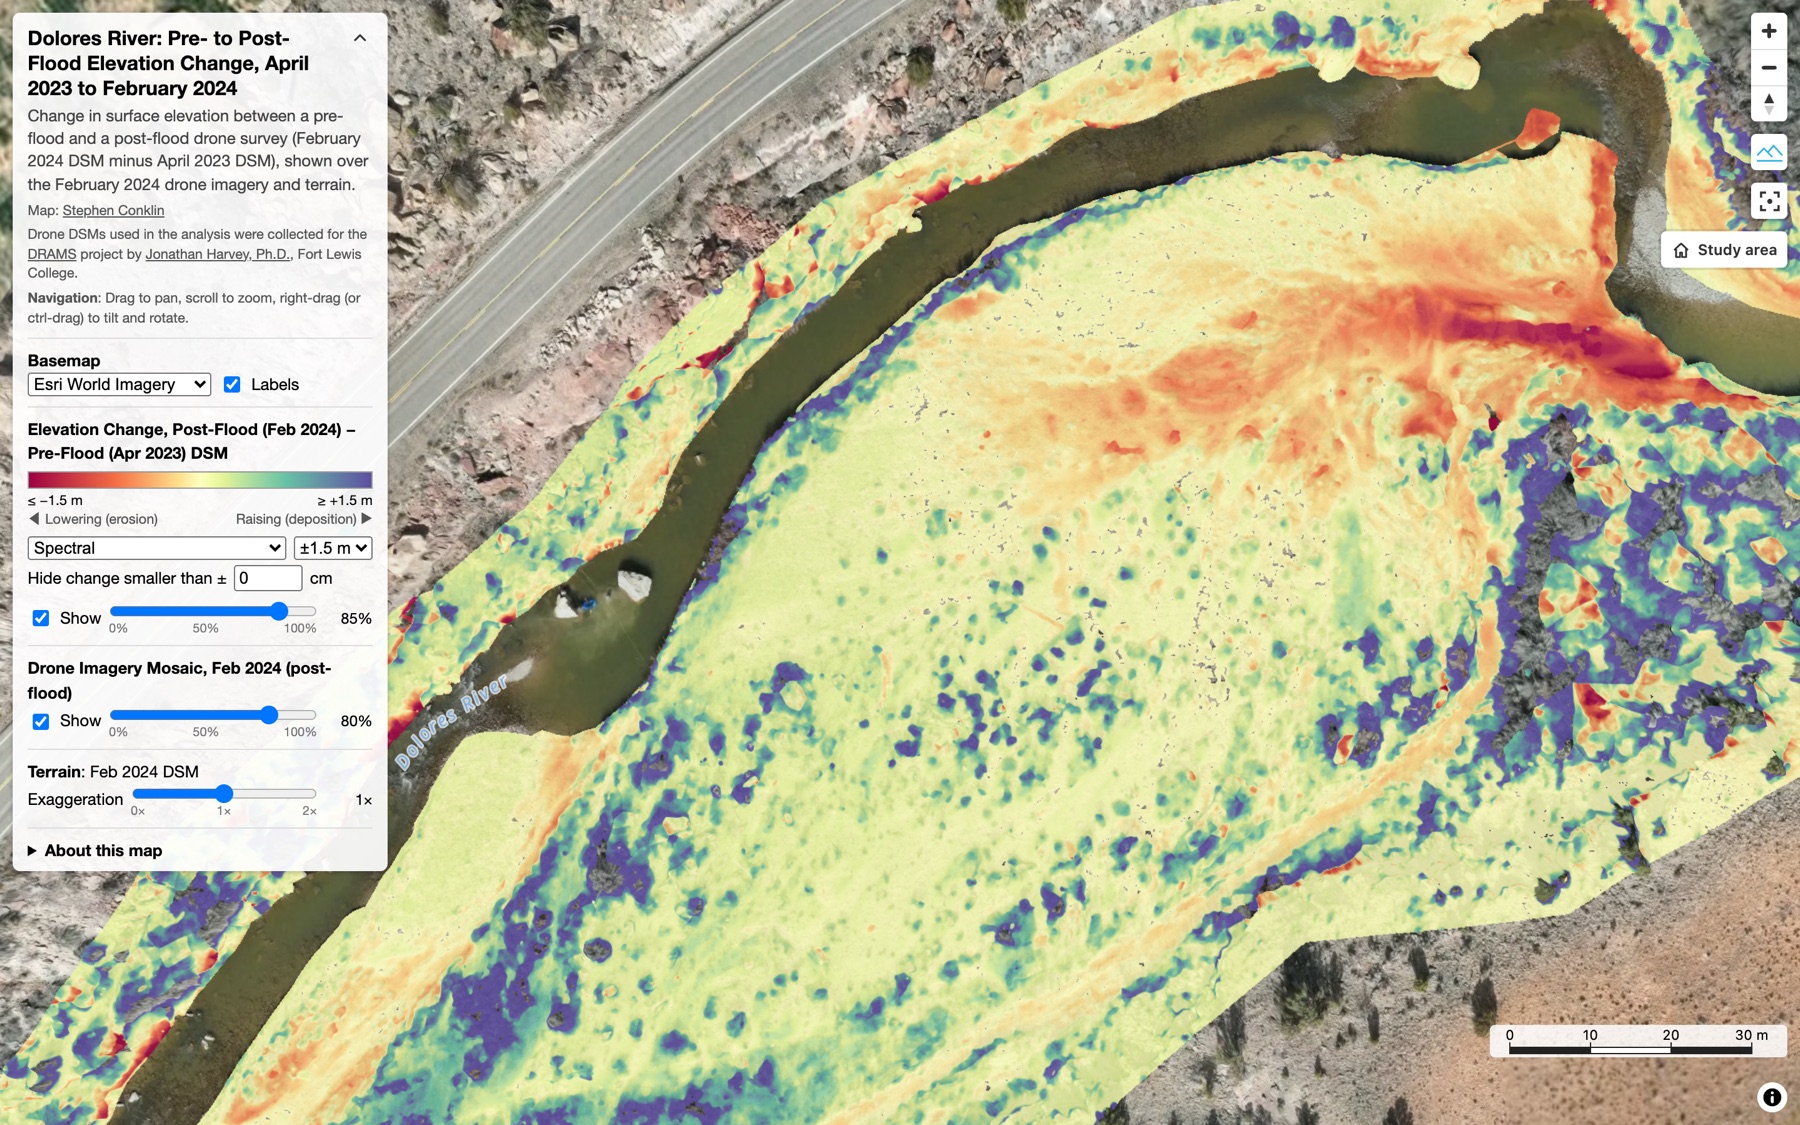
Two drone surveys never line up perfectly, so a raw elevation difference is full of small, false changes. The map’s panel gives you the controls to separate real change from noise:
- Hide change smaller than ± X cm. The minimum level of detection, 20 cm by default. Change smaller than this falls within the surveys’ measurement uncertainty and is hidden.
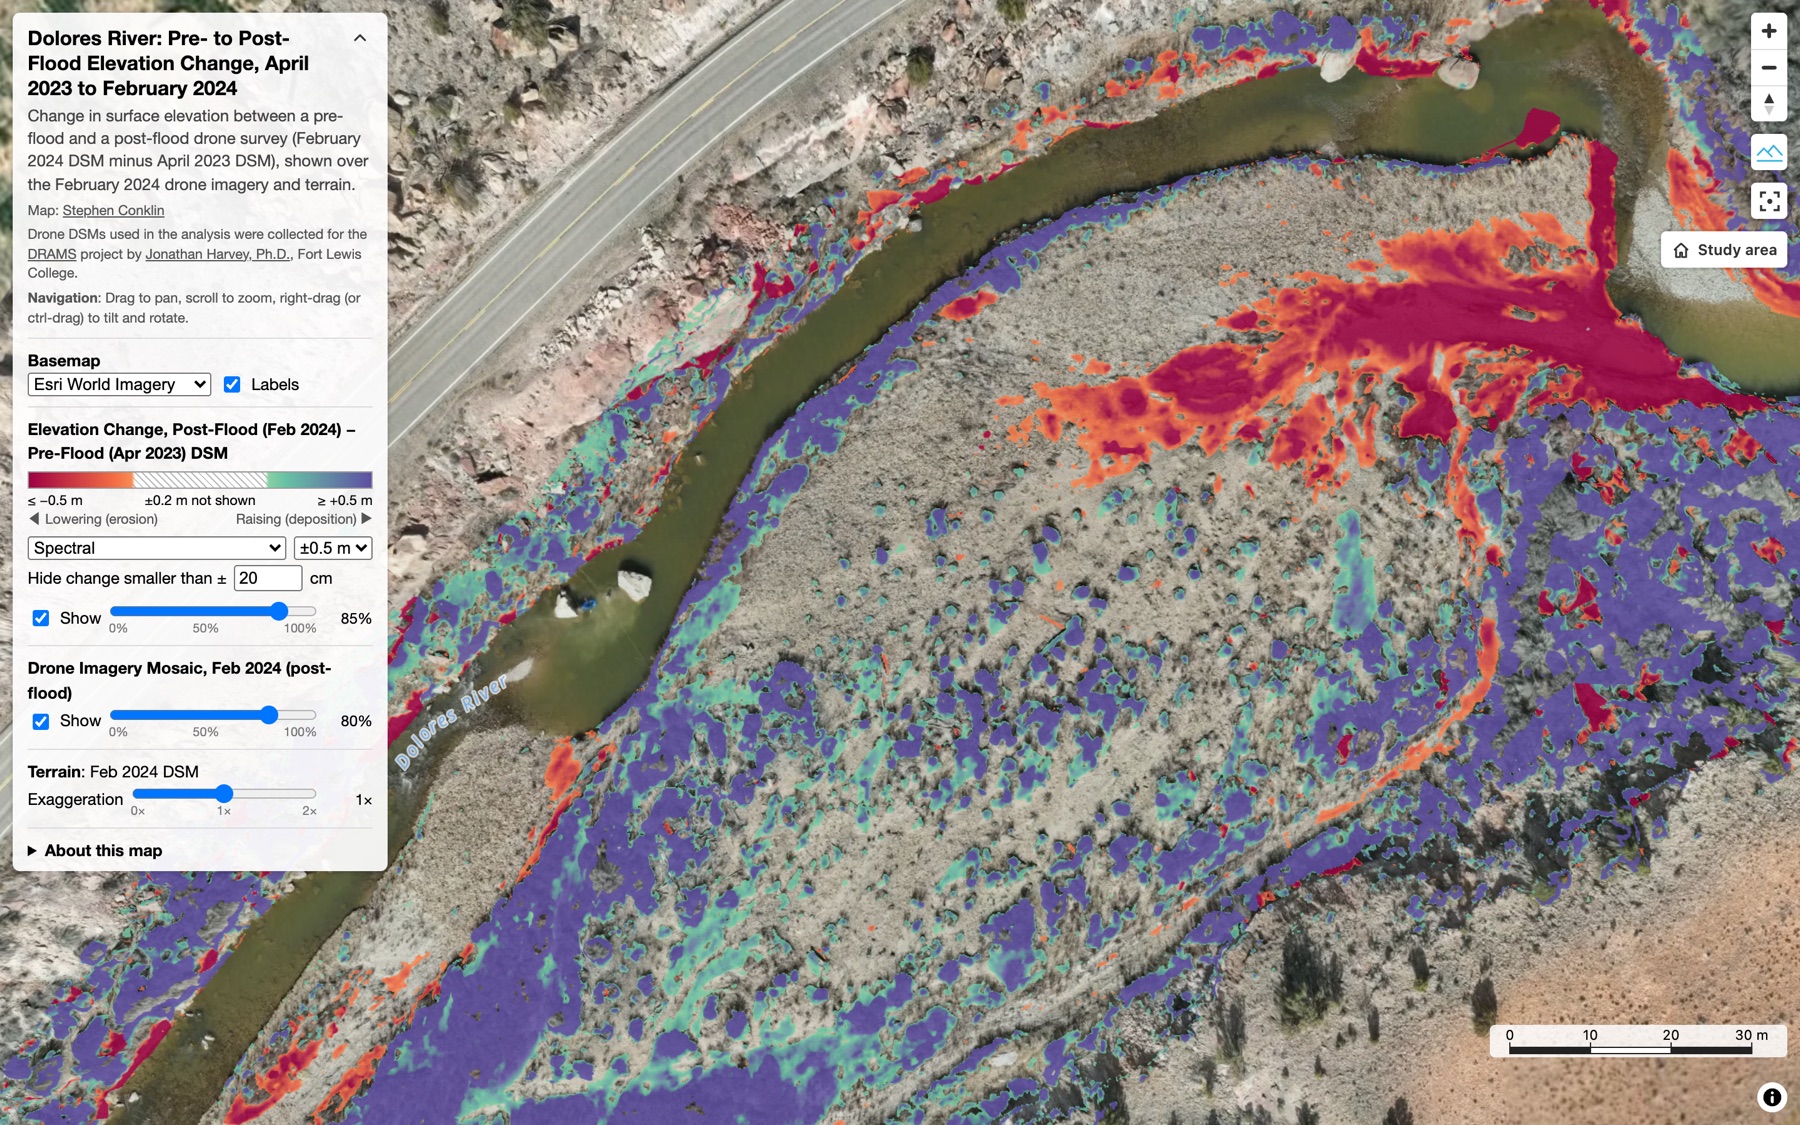
- Range (the stretch). Sets the minimum and maximum of the color ramp: ±0.5, ±1, ±1.5 (default) or ±2 m. A narrow stretch makes subtle change stand out; a wide one shows the full range but washes out the rest.
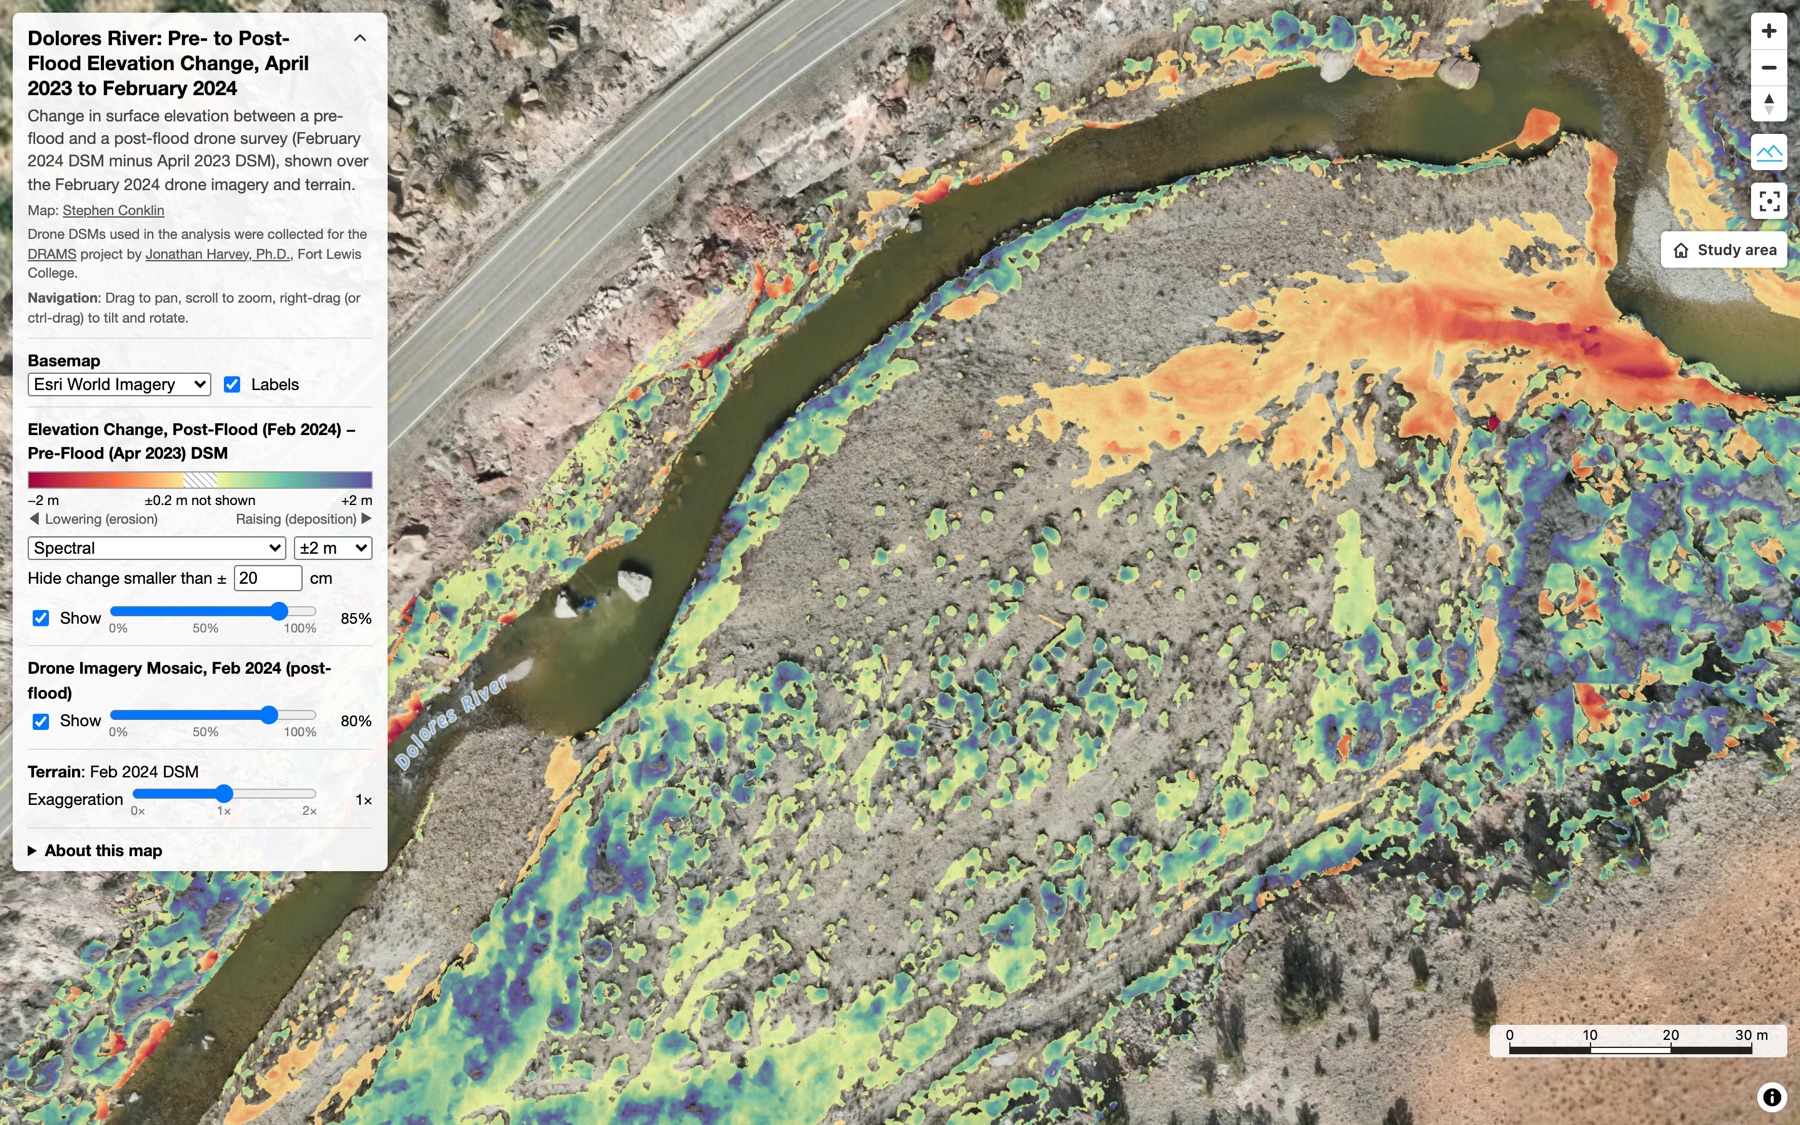
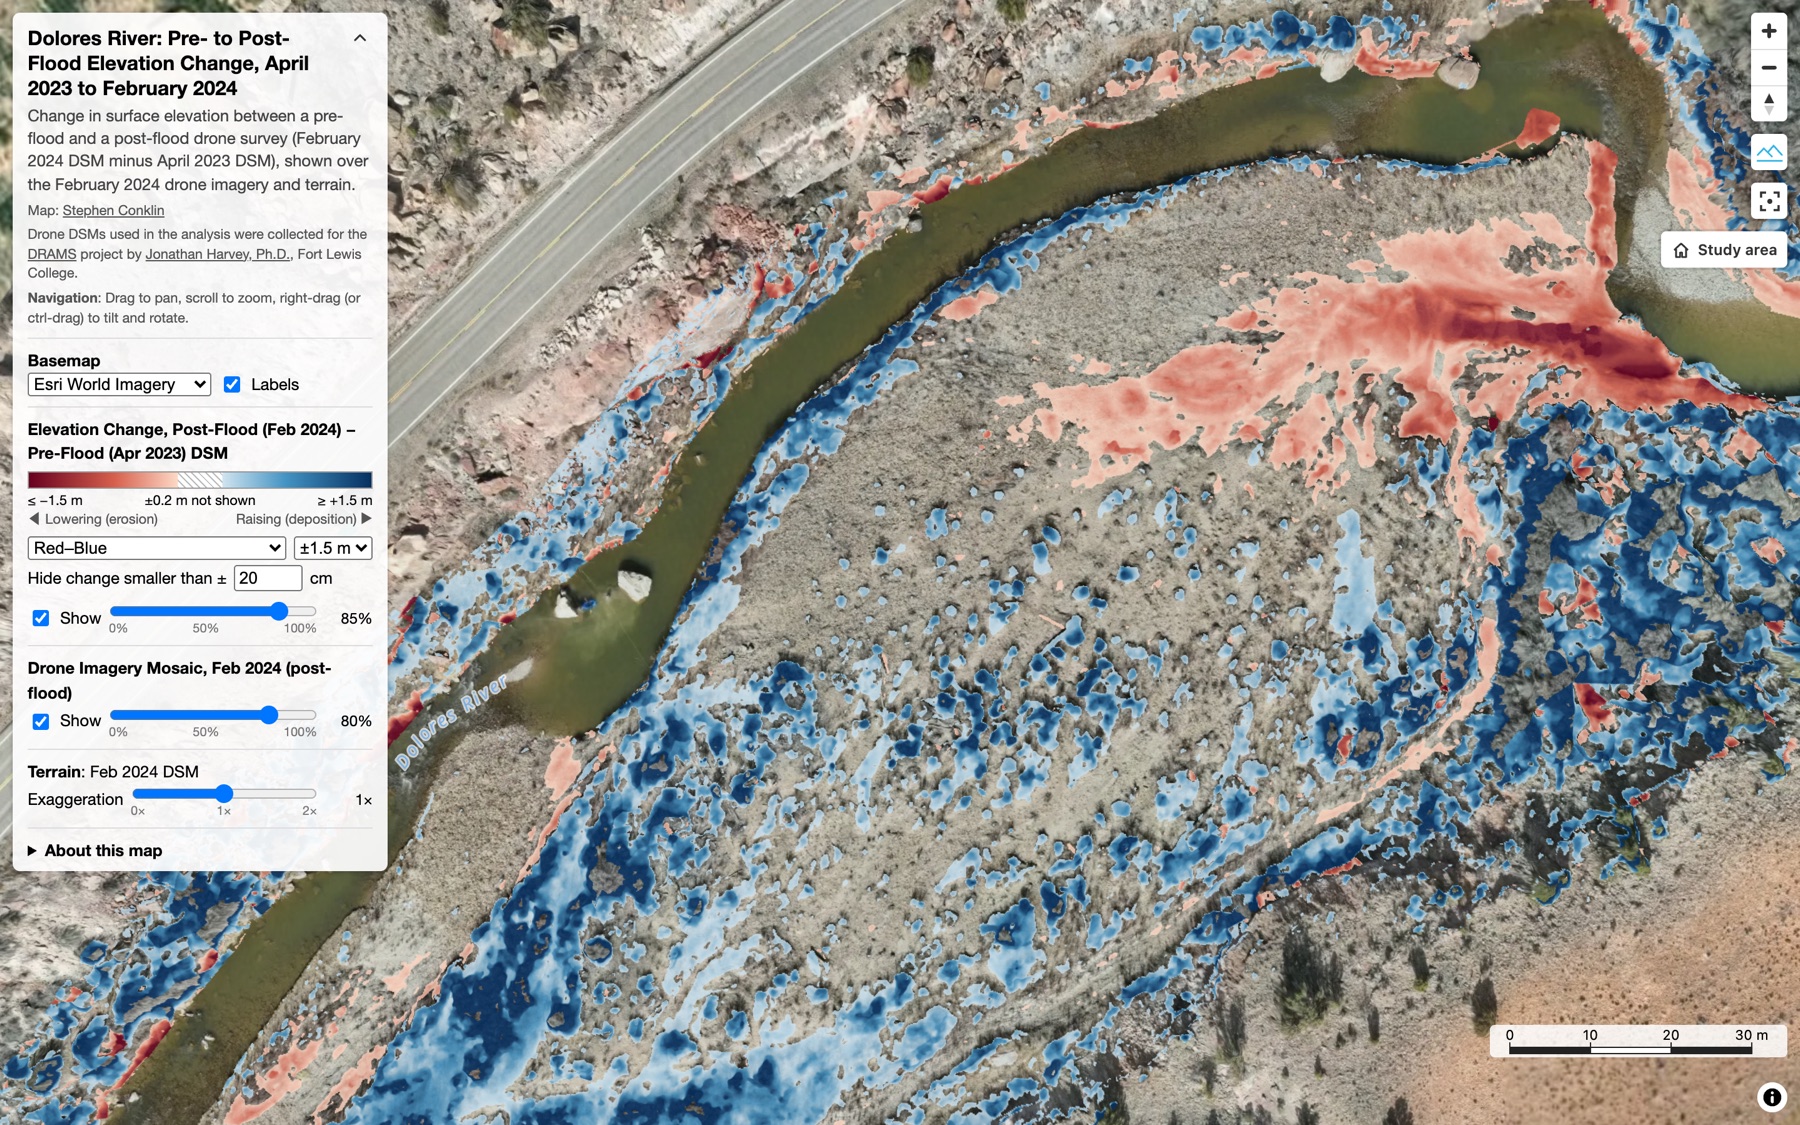
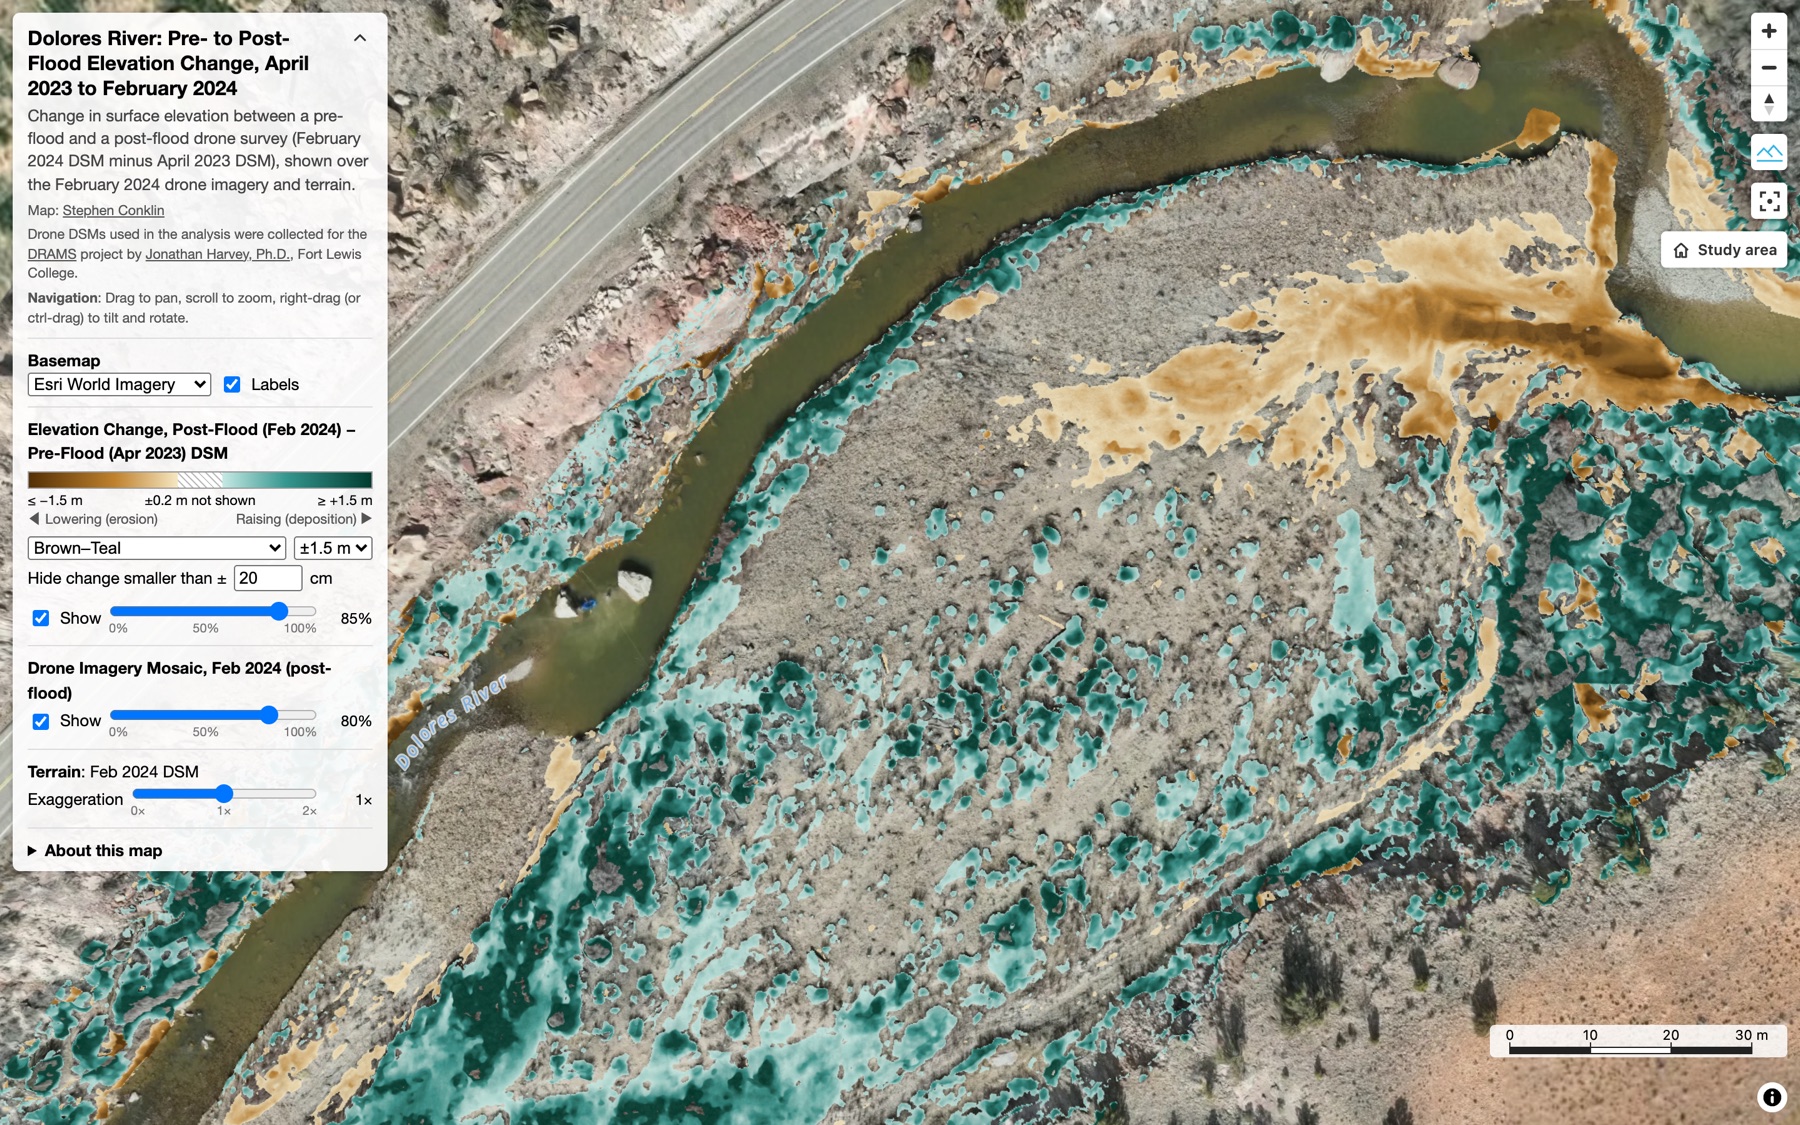
- Color ramp. Four diverging ramps (Spectral, Red–Blue, Brown–Teal, Red–Yellow–Blue), all centered on zero.
- Always excluded: change beyond ±2 m, which is likely survey artifacts rather than real change.
- Opacity and terrain: fade the change layer or the drone imagery, and exaggerate the terrain.
The comparisons below show the same view under different settings.
Engineering
- Change values are colored in the browser, not baked in. The change raster is encoded as Terrarium tiles (zoom 14–21) and colored by a MapLibre
color-relieflayer, so the ramp, stretch and detection threshold are all live controls. - Merged terrain: MapLibre allows only one terrain source, so a custom
sitedem://protocol serves the 1.8 cm drone DSM inside the survey area and falls back to AWS Terrain Tiles everywhere else. - No build step: plain HTML and ES modules with a pinned MapLibre version, hosted on GitHub Pages.
Source rasters are 1.5–1.8 cm cells in NAD83(2011) / UTM 12N, tiled with GDAL and custom Python scripts.
Comparing settings: what the change layer adds
The same top-down view of the flood bar, with and without the elevation-change layer.
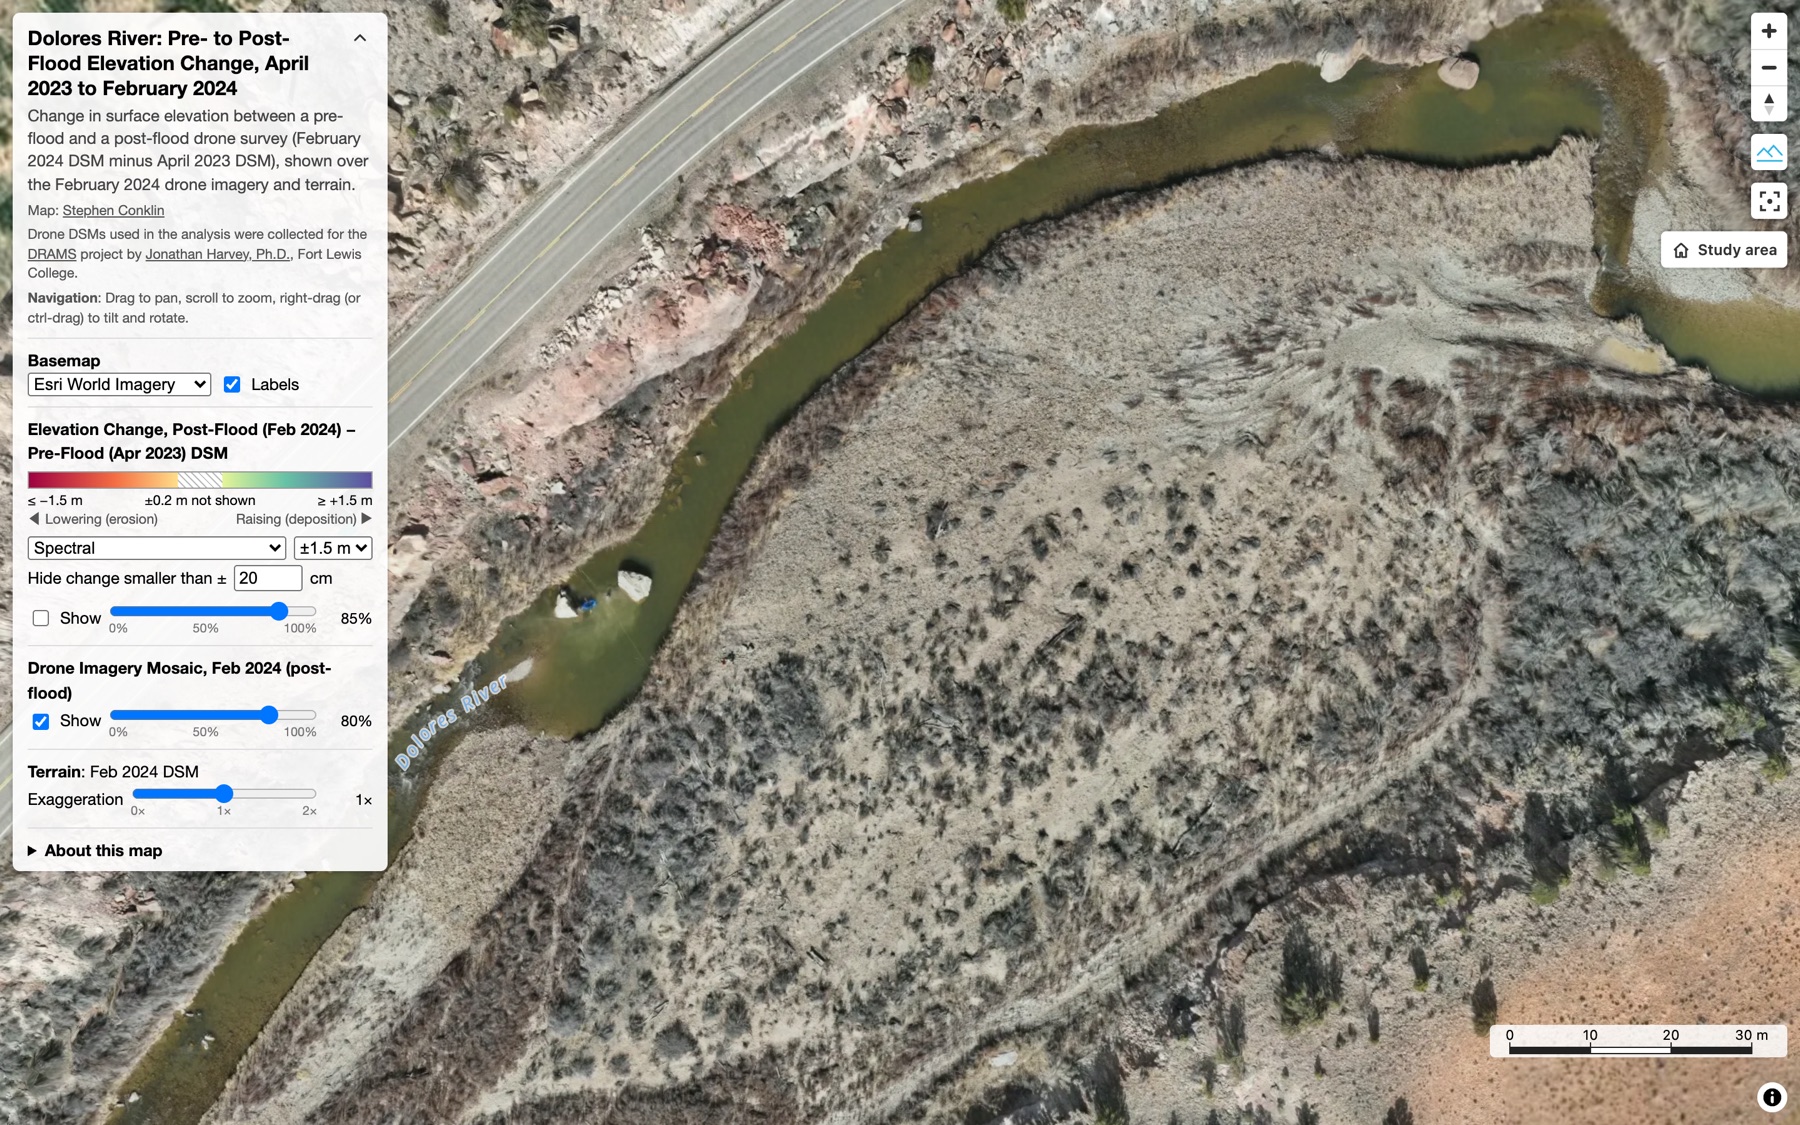
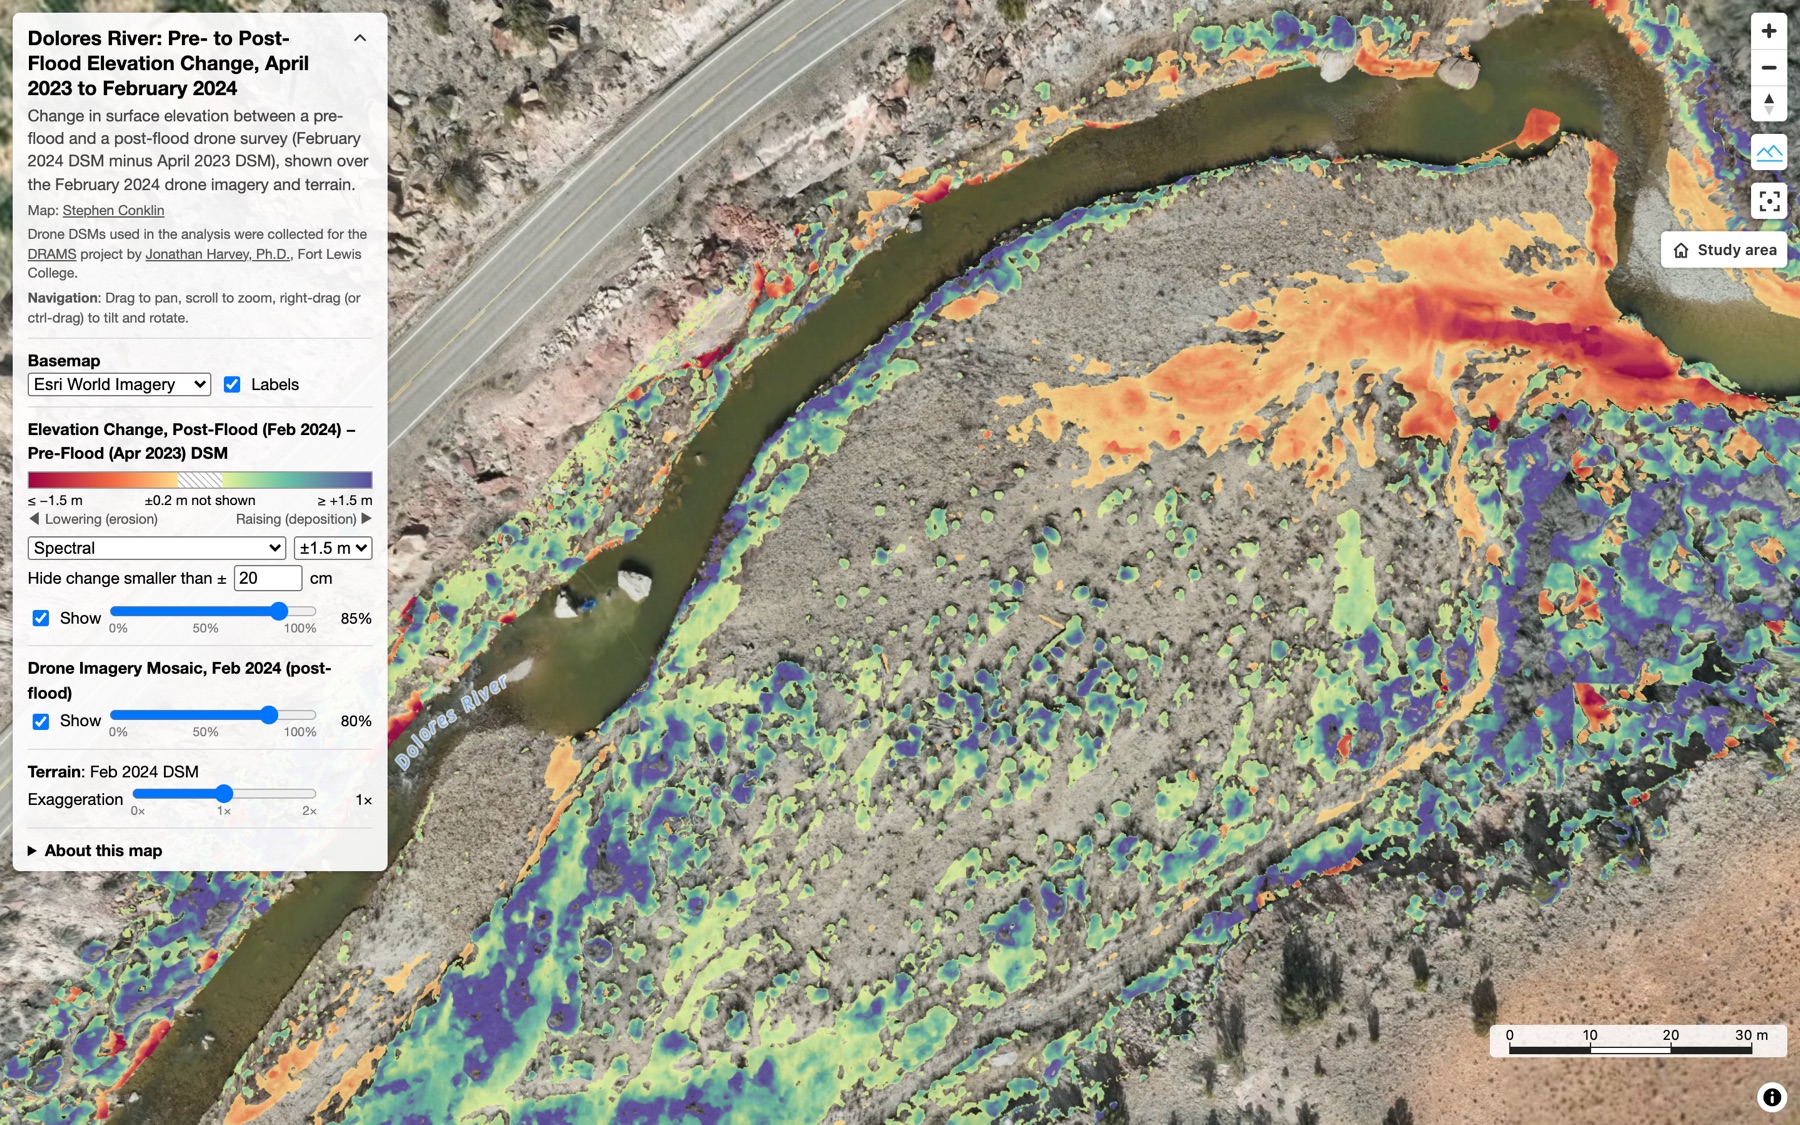
Hiding change within measurement uncertainty
Small differences between two drone surveys are mostly measurement error, not real change. The minimum level of detection hides everything smaller than a threshold you choose.
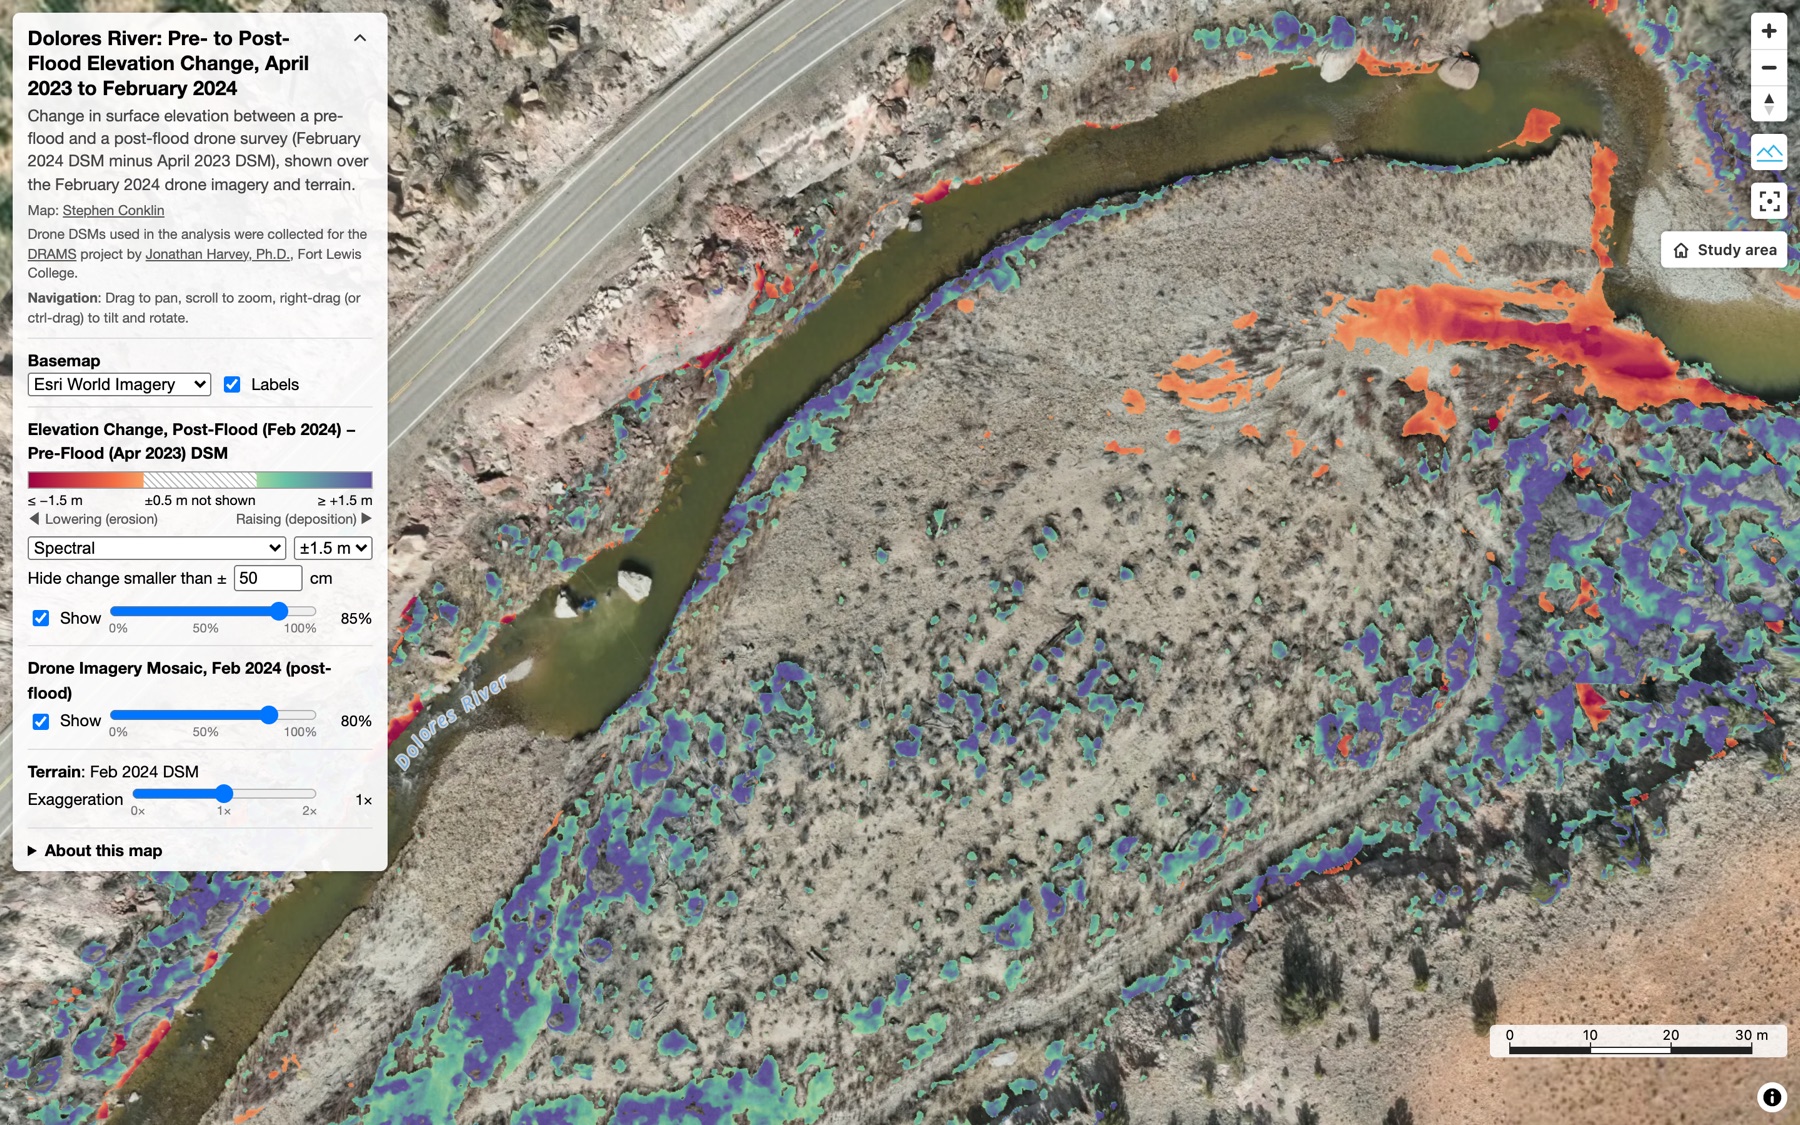
Setting the stretch (the color ramp’s min and max)
The stretch decides which amount of change gets the strongest colors. Change beyond it takes the end colors.
Choosing colors
Four diverging ColorBrewer ramps, all centered on zero: warm for erosion, cool for deposition.
Maps